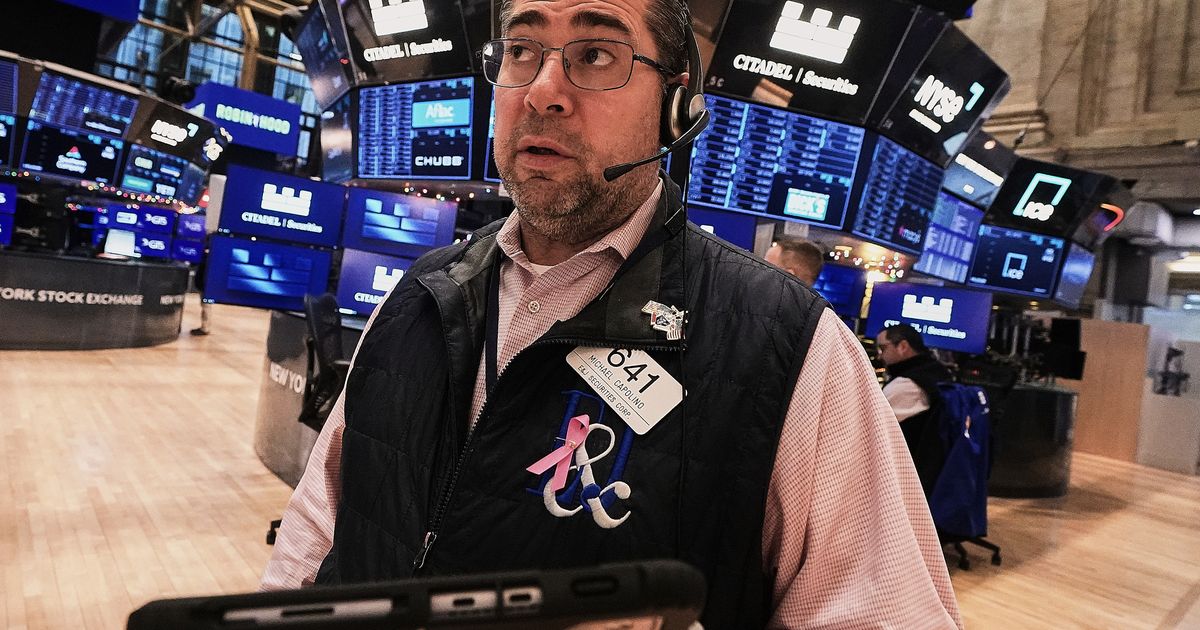
U.S. equities opened the year tepidly with the S&P 500 up 0.2%, Nasdaq +0.1% and the Dow adding 289 points (+0.6%) as technology and AI names led intraday swings (Nvidia +1.4%, Broadcom +0.4%; Apple -0.7%, Microsoft -2.4%). Sector headlines included Tesla sliding 2.6% after reporting a second consecutive year of falling sales, furniture retailers jumping (RH +9.5%, Wayfair +6.3%) following a presidential delay of proposed tariffs on upholstered furniture, and Alibaba/Baidu rallying in Hong Kong on plans to spin off an AI chip unit. Treasuries were steady (10-year 4.19%, two-year 3.48%), U.S. crude ~$57.38/bbl and Brent ~$60.77/bbl, and markets are positioning into a week of economic data that, alongside inflation still above the Fed's 2% target, leaves investors expecting the Fed to hold rates in January.
Market structure: AI/hardware winners (NVDA, AVGO, data‑center suppliers) continue to capture disproportionate market cap and intraday volatility; their earnings leverage to GPU/accelerator demand means a 10–20% move in capex outlook can swing sentiment. Consumer cyclical losers (TSLA, discretionary names tied to durable goods) are vulnerable to demand softness and tariff noise—RH and W are short‑term beneficiaries of the tariff delay but face medium‑term demand risk. Cross‑asset: stable 10y at ~4.19% and 2y at ~3.48% keeps growth valuations sensitive to macro prints (jobs, services PMI) ahead of the late‑Jan Fed meeting, supporting equity funding costs but raising option skews in large caps.
Risk assessment: Tail risks include a Fed surprise (re‑tightening or signaling more restraint) that re‑prices long‑duration AI winners, Chinese regulatory or approval delays for spin‑offs (Kunlunxin) and an AI demand miss if hyperscalers slow capex — each could cut consensus growth by >15% in affected names. Time horizons: days — headline‑driven volatility around jobs/PMI; weeks — earnings and Fed decision windows; quarters — secular demand for AI hardware and cloud services. Hidden dependencies: revenue growth for NVDA/AVGO is second‑order linked to enterprise software adoption and hyperscaler budgets, not just chip supply; concentration risk magnifies drawdowns.
Trade implications: Direct plays: establish modest long exposure to NVDA and AVGO (size 1.5–3% each) via cost‑controlled option structures; trim TSLA exposure by 40–60% after continued sales declines and reallocate to short‑term tariff beneficiaries (RH, W) sized 0.5–1.5% for 1–3 month plays. Pair/option strategies: implement 3‑month NVDA call spreads (buy ATM, sell +25% strike) targeting +15–25% upside and defined cost; buy 2–3 month Nasdaq 100 5% OTM put spread as a 0.25–0.5% portfolio tail hedge ahead of Jan prints. Monitor Chinese filings for Kunlunxin within 60–120 days before adding longer‑dated BABA/BIDU exposure.
Contrarian angles: Consensus overweights AI secular upside but underestimates revenue concentration and margin cyclicality — a 10–20% capex pause would disproportionately hit NVDA/AVGO multiples. The pullback in AAPL/MSFT may be an overreaction to daily flows; consider selective covered calls or collars instead of outright shorts for idiosyncratic risk. Historical parallels to semicap cycles (2018–19) suggest mean reversion in hardware after frothy multiples; unintended consequence is rising systemic beta—force disciplined hedging and position sizing.
AI-powered research, real-time alerts, and portfolio analytics for institutional investors.
Request DemoOverall Sentiment
mixed
Sentiment Score
0.05
Ticker Sentiment
