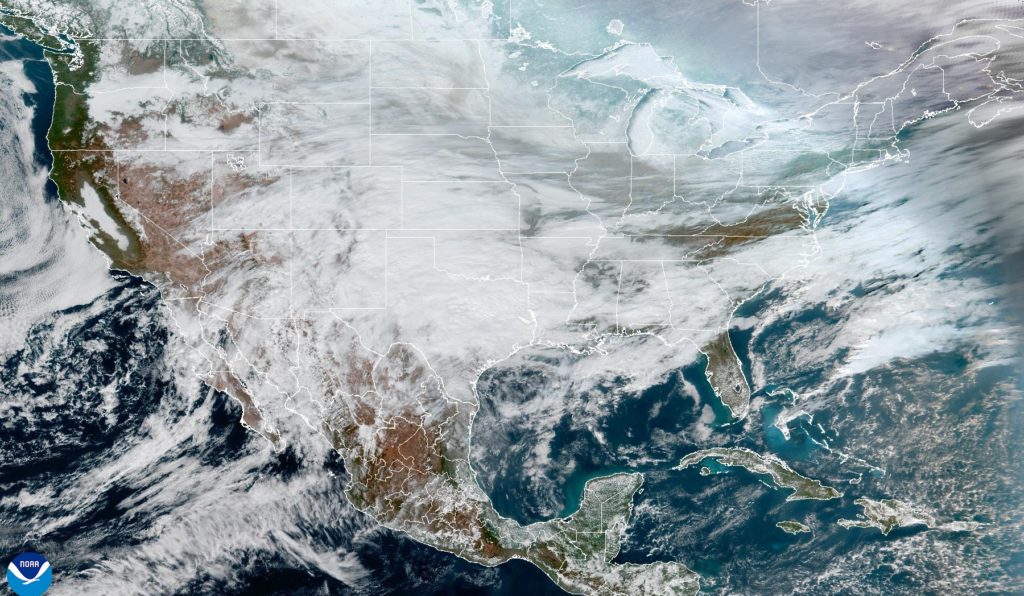
A large winter storm is forecast to affect over half of the U.S., with at least 177 million people under ice and snow watches or warnings and more than 200 million under cold-weather advisories; the National Weather Service predicts roughly 12 inches (30 cm) of snow from Washington, D.C., through New York and Boston. Ice and sleet are expected to begin in Texas and Oklahoma before the system moves into the Northeast, and forecasters warned damage—particularly from ice—could rival a hurricane, implying significant disruptions to travel, regional energy demand and logistics that could compress local economic activity and create idiosyncratic operational risk for affected sectors.
Market structure: The storm will create immediate winners in energy (heating oil, natural gas) and winter-supply chains (home improvement, road salt, generators) while hurting airlines, regional rails, parcel carriers and local retail in affected corridors. Expect 5–25% short-term spikes in localized diesel/heating demand and 10–30% swings in regional natural gas nodal prices if temperatures persist 3–7 days below normal; utilities with firm gas contracts will see margin pressure but renewables + demand-response gain pricing leverage. Competitive dynamics: Large national retailers (HD, LOW) and vertically integrated refiners (PSX, VLO) can capture share from smaller players and opportunistically raise prices; small carriers and regional insurers will face outsized claims and cancellation-driven revenue loss, shifting market share to financially stronger incumbents. Supply/demand: Temporary supply-chain bottlenecks (road closures, rail slowdowns) will tighten onshore diesel and distillate inventories; if storage draws exceed 5–10% of regional stocks over two weeks, expect broader futures curve contango to steepen, pressuring short-term spreads.
Risk assessment: Tail risks include a prolonged multi-week grid outage (Texas-style) that forces regulatory capex and liability claims, and a refiner/terminal outage from icing that could push regional fuel prices 50%+ for days. Immediate (0–7 days) impacts are operational — cancellations, road closures; short-term (weeks) are inventory draws and claims; long-term (quarters) are higher insurance pricing and potential regulatory scrutiny of grid resilience. Hidden dependencies include reinsurance retro pricing in Q1 renewal season and municipal emergency response budgets; a federal disaster declaration would accelerate insurance payouts and treasury flows. Catalysts that could worsen or reverse trends: model errors extending the cold by >7 days, supply-line reopens (rail/ports) restoring supply quickly, or a warm-backfill that collapses hedged energy positions.
AI-powered research, real-time alerts, and portfolio analytics for institutional investors.
Request DemoOverall Sentiment
moderately negative
Sentiment Score
-0.35
Trade implications: Direct plays: long natural gas exposure (short-dated) and refiners; short or buy puts on airlines/regionals and parcel plays with high last-mile exposure. Pair trades: long HD/LOW (consumer staples grouping) vs short AAL/UAL to capture durable goods demand vs travel disruption. Options: buy 30–45 DTE call spreads on UNG or PSX to limit downside while targeting 15–30% moves; buy puts on AAL/UAL with strikes ~10% OTM to cap risk. Sector rotation: shift 2–5% from cyclical leisure/transport into utilities (regulated) and energy midstream for 1–3 month window, then reassess once weather normalizes.
Contrarian angles: Consensus overweights immediate headline losses in airlines; market may under-price downstream benefits to refiners and home-improvement names — historical parallels (Feb 2015, Jan 2018 winter storms) show 7–12% outperformance in HD/LOW and 10–25% natural gas/ distillate pops that revert in 6–8 weeks. Reaction could be overdone in shorting utilities: regulated names with cost recovery mechanisms often see stabilizing cash flows and modest rerating if storm drives capex authorization. Unintended consequences include accelerated electrification/backup generator demand lifting long-term natural gas and renewable-plus-storage capex, creating a multi-quarter constructive backdrop for select infrastructure names if cold events cluster.
