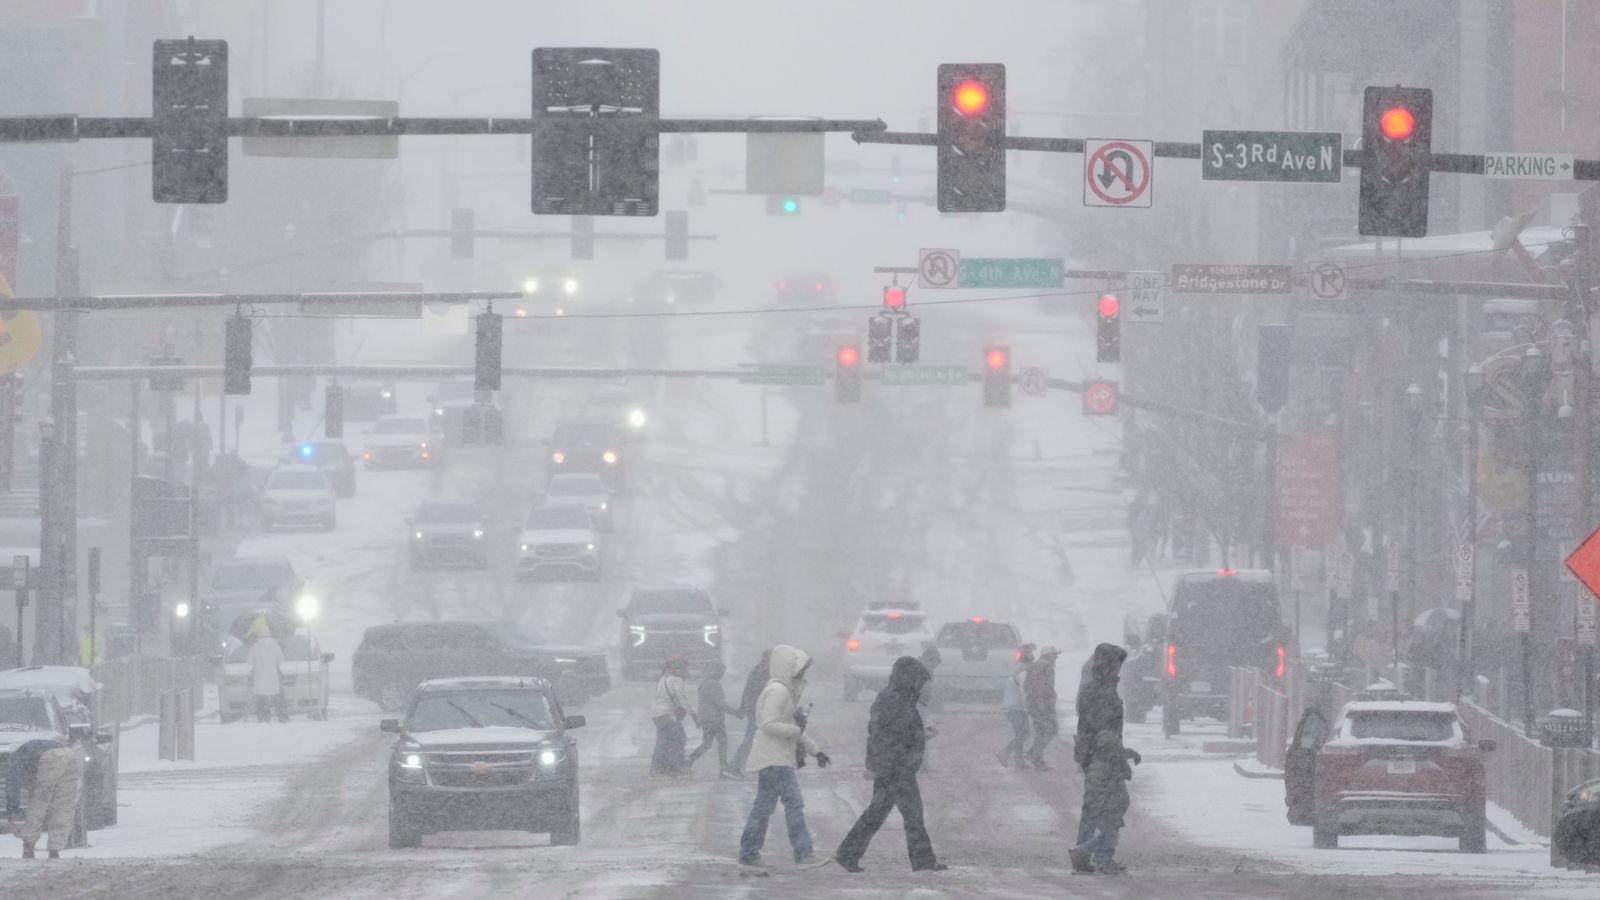
A sprawling winter storm stretching some 2,000 miles from the southern Rockies to New England has left roughly 140,000 households without power and threatened almost 180 million people across 37 states, prompting emergency declarations in at least 17 states plus DC. The storm forced more than 13,000 flight cancellations over the weekend—the highest single‑day total since the COVID pandemic—and produced major outages concentrated in Louisiana (~58,000) and Texas (~50,000). For investors, near‑term implications include operational disruption and revenue hits for airlines and travel operators, elevated demand/strain on utilities and potential insurance claims, and localized supply‑chain and logistics slowdowns as authorities impose travel limits and mobilize sanitation and emergency crews.
Market structure: Broad 2,000-mile storm reorders short-term winners (regulated utilities, local contractors, home-improvement retailers) and losers (airlines, regional airports, perishable logistics). Expect a 5-15% intraday to multi-day uplift in spot power and natural gas in affected regions as heating demand spikes; meanwhile transport network effects create revenue pressure for airlines (cancellations >13k signals multi-day throughput loss). Municipal services and emergency contractors gain pricing power for 1–3 months where outages exceed 50k customers per state.
Risk assessment: Tail risks include a prolonged grid emergency in ERCOT/SE (blackouts >48 hours) or insured-loss shock >$2bn that pressures regional insurers and muni credit spreads. Immediate (0–7 days): operational hits to airlines and logistics; short-term (1–3 months): recovery capex and consumer repair spend; long-term (3–12+ months): potential regulatory scrutiny of grid resilience and insurance repricing. Hidden dependency: concurrent commodity/energy price spikes can feed CPI components and influence Fed expectations over 1–2 quarters.
Trade implications: Favor short-dated nat gas exposure (Henry Hub sensitivity) and select regulated utilities with storm-recovery earnings mechanisms (NEE, DUK, SO); avoid/short airlines (DAL, UAL, AAL) into near-term earnings windows. Use options to monetize volatility — calendar or 2–6 week call spreads on UNG or front-month gas futures; buy 3–6 month protective puts on major carriers sized to 0.5–1% portfolio risk.
Contrarian angles: Consensus focuses on travel pain; underappreciated is outsized aftermarket demand for building materials and localized power generation (gensets, batteries) which can lift HD/LOW and industrial names (CAT, HON) for 3–6 months. Historical parallels (2014–2019 storms) show sharp retail spending rebound in 2–8 weeks; therefore, sell panic in re-opening airline exposure and rotate into durable goods and regulated utilities once outages fall below 20k/state.
AI-powered research, real-time alerts, and portfolio analytics for institutional investors.
Request DemoOverall Sentiment
moderately negative
Sentiment Score
-0.50
