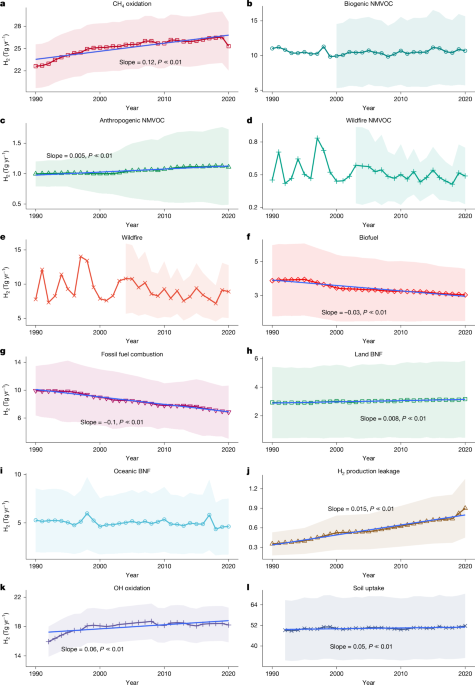
A new comprehensive 2010–2020 global hydrogen budget estimates mean sources of 69.9 ± 9.4 Tg H2 yr−1 and sinks of 68.4 ± 18.1 Tg H2 yr−1, with photochemical production (38.4 Tg yr−1, 56% of sources) and soil uptake (50.0 Tg yr−1, 73% of sinks) dominant. Key numbers: H2 from CH4 oxidation ≈26.1 ± 3.5 Tg yr−1, leakage from industrial production ≈0.7 ± 0.4 Tg yr−1 (assuming 1 ± 0.5% leakage), and atmospheric H2 rise contributed ~0.020 ± 0.006 °C to global surface temperature over 2010–2020. For investors, the paper signals that the climate and regulatory value of scaling hydrogen depends critically on leak management and methane controls—economy-wide leakage of 1–10% materially alters net climate benefits and will shape policy, infrastructure and technology risk premia.
Market structure: Industrial gas majors (Linde, Air Products) and large diversified engineering firms gain most — they can monetize plant-scale production, low-leakage distribution and CCS for blue H2 while pure-play electrolyzer/retail H2 names face margin pressure if leakage/regulation tightens. Key capacity numbers: photochemical H2 sources ≈38 Tg/yr vs soil sink ≈50 Tg/yr means the market is sensitive to small net imbalances; economy‑wide leakage assumptions (1–10%) will materially change demand economics and permit pricing power for firms able to guarantee <1% losses.
Risk assessment: Tail risks include regulatory caps on allowable leakage (trigger if measured system leakage >≈5%) or methane‑linked reputational shocks that stall subsidies; operational risk arises from under‑measured leakage (current measurement tools limited). Time horizons: immediate (0–3 months) informational — new sensor deployments and pilot leak studies; short (3–12 months) — policy and subsidy updates; long (1–5 years) — infrastructure buildout and commodity impacts (Ni, Ir, Cu demand).
Trade implications: Favor capacity owners and service providers over manufacturing pure‑plays; liquidity and volatility will remain high in small H2 names so use option structures to express views. Cross‑asset: expect incremental demand for critical metals and elevated capex funding for muni/credit issuance for H2 hubs; higher credit spreads for greenfield pure‑play developers if regulatory leakage thresholds tighten.
Contrarian angle: Consensus underestimates commercial value of verifiable low‑leakage solutions and monitoring — winners will be not the cheapest electrolyzer but the integrated suppliers who can contractually guarantee leakage <1%. Pure growth valuations for small electrolyzer names look stretched vs. realistic rollout (3–7 year commercialization), creating exploitable relative‑value opportunities.
AI-powered research, real-time alerts, and portfolio analytics for institutional investors.
Request DemoOverall Sentiment
mildly negative
Sentiment Score
-0.25
