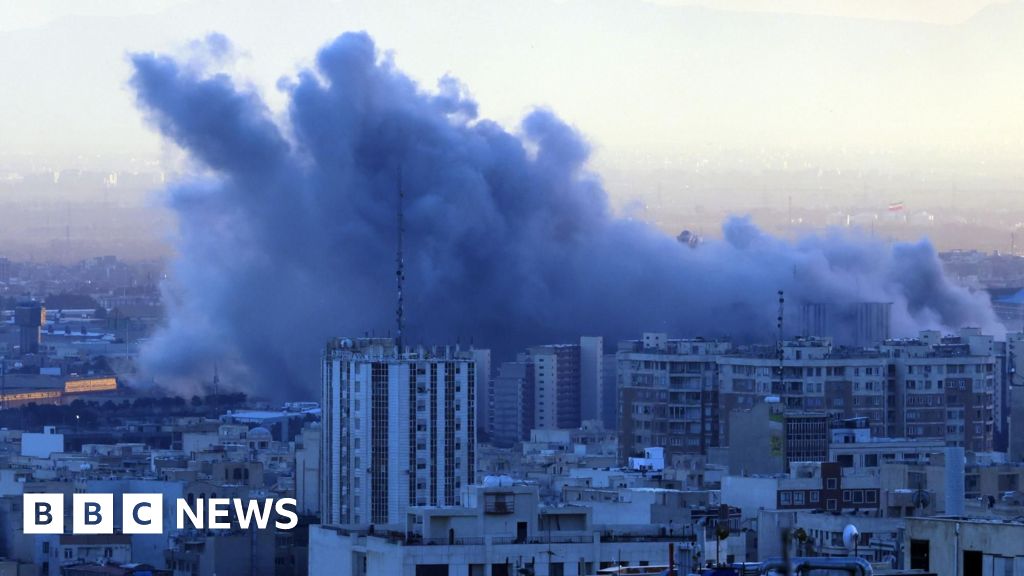
US and Israeli forces have conducted multi-day strikes across Iran, reportedly killing Supreme Leader Ayatollah Ali Khamenei and senior officials and hitting presidential, security and suspected nuclear-related sites; satellite imagery and the IAEA confirmed some damage at Natanz but no radiological release. Iran has launched hundreds of missiles and drones at Israel and Gulf states hosting US bases, with the Iranian Red Crescent reporting roughly 787 dead over four days and other sources citing 742 civilian deaths (including 176 children); several US service personnel and allied personnel were also killed. Iran has closed the Strait of Hormuz — a transit route for about 20% of global oil and gas shipments — and the UK and France have dispatched naval assets, markedly increasing geopolitical tail risk and likely driving risk-off positioning and elevated volatility in energy and regional markets.
Market structure: The immediate winners are energy producers and defense contractors (XOM, CVX, XLE, LMT, NOC, RTX) as supply risk and defense spending shocks increase pricing power; losers are airlines (AAL, UAL, DAL), regional tourism and EM FX exporters/importers (TRY, ILS, AED exposure) and container shipping (ZIM) due to route risk and higher insurance/freight. Oil supply disruption risk (Strait of Hormuz closure) implies a shorter physical spare capacity cushion and 2–4 week inventory draws; a 10–30% move in Brent within days is plausible if closures persist. Cross-asset: expect a safe-haven bid (GLD, TLT) and USD strength (UUP) near-term, but higher long-run fiscal/insurance/back-fill spending could steepen curves after 3–6 months.
Risk assessment: Tail scenarios include full regional blockade (20% of seaborne oil disrupted) driving Brent > $130 (+50%+), major cyberattacks on oil infrastructure, or escalation drawing in larger powers triggering global growth shock (-2–4% GDP hit to EM trade partners). Time horizons: days — volatility spike, liquidity dislocations; weeks–months — commodity-driven inflation and EM stress; quarters — defense capex reallocation and global supply-chain re-shoring. Hidden dependencies: insurance market capacity (War Risk premiums), shipping rerouting costs, and semiconductor/auto supply chains reliant on Gulf-sourced petrochemical inputs; monitor P&I and Lloyd’s notices and war-risk premium levels.
Trade implications: Near-term tactical: buy oil & gas producers and physical oil proxies (2–4% portfolio weight in XLE or 3–5% in XOM/CVX) and defense names (1–2% each LMT, NOC) while hedging equities with 1% portfolio SPX 1-month 5% OTM puts or VIX call spreads. Use options: buy 3-month XLE call spreads (e.g., 0–15% OTM) and buy 1–2 month puts on AAL/UAL sized to 0.5–1% to capture travel demand hit. Rotate out of cyclical consumer/leisure names and increase cash by 3–5% if Brent breaches +20% within 10 trading days.
Contrarian angles: The market may overpay short-term for “headline” defense winners — prefer structurally advantaged contractors with backlog visibility (LMT, RTX) over smaller primes; energy upside may be capped if diplomatic corridors reopen within 4–8 weeks or if OPEC quickly releases spare. Historical parallels (Gulf Wars 1990/2003) show 6–12 month mean-reversion in oil after initial spikes; consider scaling out energy longs above target thresholds (trim at +30% P/L) and buy cyclicals on dispersion-induced sell-offs after 6–8 weeks.
AI-powered research, real-time alerts, and portfolio analytics for institutional investors.
Request DemoOverall Sentiment
strongly negative
Sentiment Score
-0.78