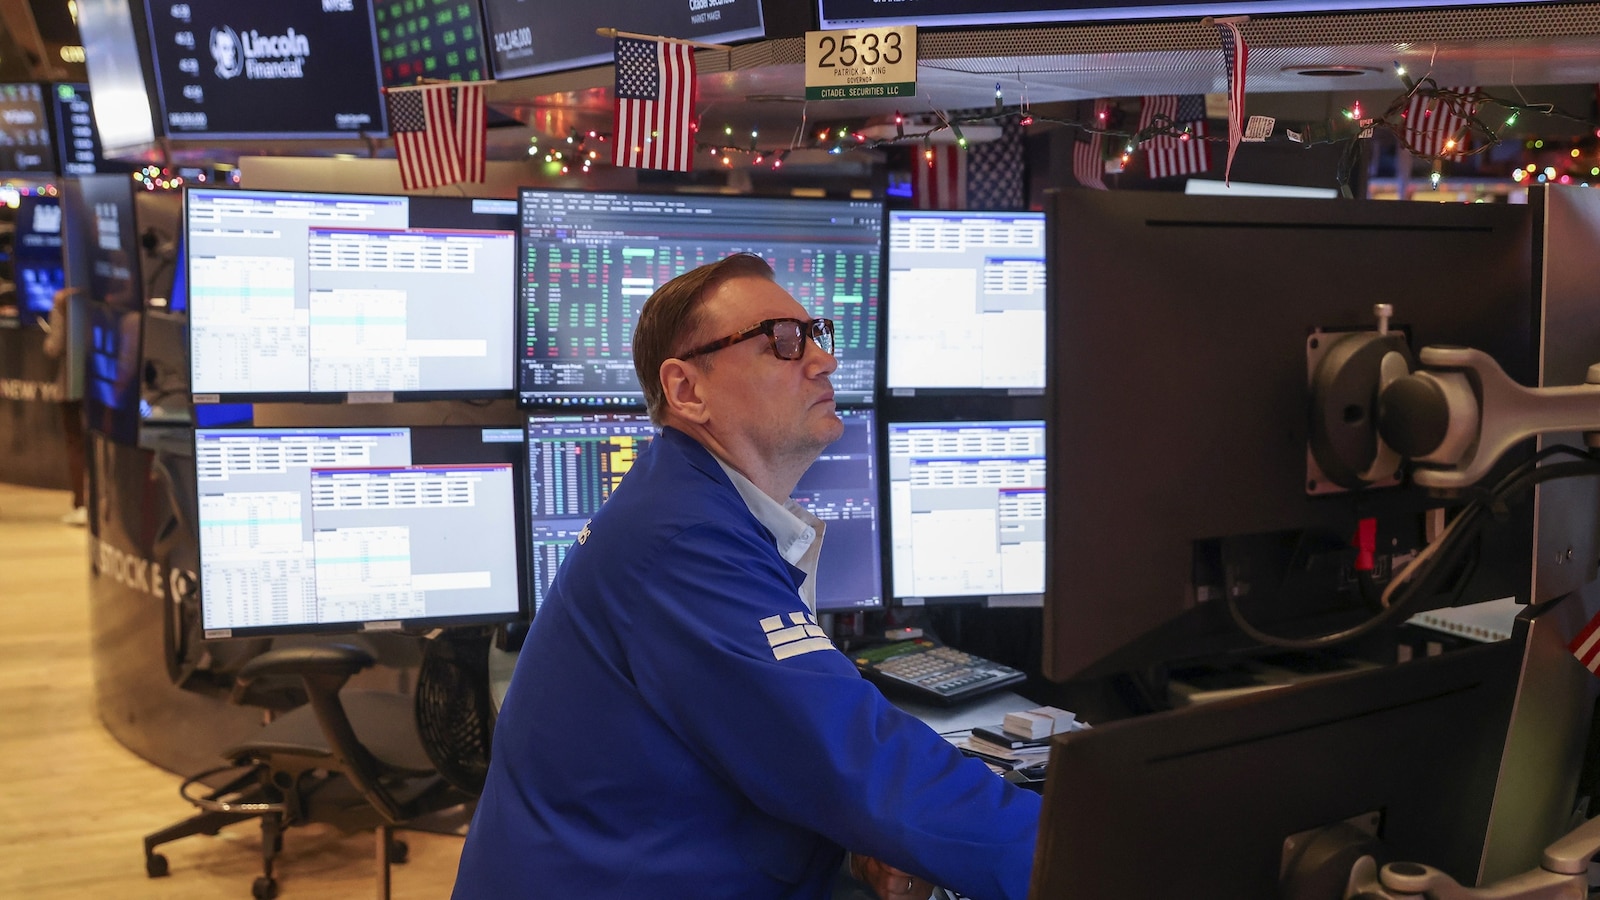
U.S. equities rallied to record highs in 2025 with the S&P 500 up roughly 17% as of Dec. 23, driven by resilient corporate earnings, interest-rate cuts and enthusiasm for AI. Nvidia reported a record ~$57 billion quarterly sales span and its stock gained about 40% YTD, while a tariff scare briefly erased roughly $3.1 trillion in market value before most levies were suspended. Economists note mixed macro data—hiring slowed and inflation remains roughly one percentage point above the Fed’s 2% target—but major firms are bullish on 2026: Vanguard forecasts up to 8% returns, JPMorgan 13–15%, Morgan Stanley and BNY Wealth around 10% (BNY’s S&P target ~7,600).
Market Structure: The 2025 rally was extremely concentrated—NVDA (+40% YTD as of Dec 23) and the “magnificent seven” captured most gains—implying winner-takes-most dynamics for AI infrastructure, cloud (AMZN, MSFT, GOOGL) and high-margin software (META, AAPL). Corporates with AI-capex exposure gain pricing power; cyclical exporters, small caps and tariff-exposed industrials are structural laggards. Supply/demand in semis points toward tight near-term device-level supply for datacenter GPUs with demand elasticity low—revenue upside can persist until supply ramps (6–12 months). Risk-on equity rallies have compressed rate volatility, pressuring long-dated bond hedges and FX flows into USD; copper/energy demand should rise incrementally with data-center scale-up.
Risk Assessment: Key tails—(1) swift Fed repricing if CPI surprises above +0.5ppt leading to >50bp yield shock, (2) regulatory/antitrust moves targeting AI monetization or export controls (Taiwan/China escalation), (3) AI capex not converting to incremental margins producing multiple compression. Time horizons: days-weeks for tariff/regulatory headlines and NVDA earnings shocks, 3–6 months for Fed guidance and capex cycles, 12+ months for structural competition and product monetization. Hidden dependency: index-level returns hinge on few names; broad-market drawdowns could be large even if earnings are OK. Catalysts to watch: NVDA quarterly guidance (next 30–60 days), January FOMC language, large cloud providers’ capex guides and any tariff policy reversals.
Trade Implications: Favor concentrated, disciplined exposure to NVDA and cloud leaders but hedge market risk. Tactical direct plays: build small capped longs (1–3% portfolio) in NVDA, MSFT, GOOGL and 0.5–1% in AMZN for secular cloud/AI; trim cyclicals (IYT, XLI) by 2–4% and raise cash. Options: use short-duration defined-risk positions to express asymmetric upside—buy 3-month NVDA call verticals (buy ATM, sell +10% OTM) sized to 0.5% portfolio with 40–60% profit target and 50% max loss cut. Pair trades: long NVDA (1%) / short IWM (1%) to capture concentration drift while hedging broad market weakness.
Contrarian Angles: Consensus underestimates the risk of profit conversion lag—AI revenue growth may outpace gross-margin expansion; if capex growth slows, multiples compress. The market may be underpricing regulatory/export-control tail risk; a targeted export ban on advanced GPUs could spike NVDA implied vols >100% and disrupt supply chains. Historical parallel: 1999–2000 rotation concentrated in a few names but fundamentals differ—this cycle has revenue growth; still, leverage your exposure and enforce tight sizing because passive concentration can accelerate downside. Unintended consequence: large passive/ETF flows into a few names can produce violent dispersion trades—sell volatility into spikes and be prepared to flip into quality on 10–20% drawdowns in megacaps.
AI-powered research, real-time alerts, and portfolio analytics for institutional investors.
Request DemoOverall Sentiment
moderately positive
Sentiment Score
0.45
Ticker Sentiment
