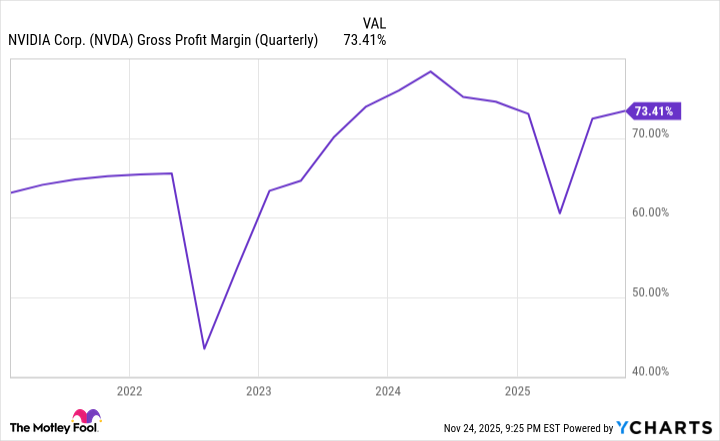
Nvidia reported $57 billion in revenue for the quarter ended Oct. 26, a 62% year‑over‑year increase, driven by outsized demand and backlog for high‑end GPUs (Hopper/H100, Blackwell, Blackwell Ultra) that command roughly $30k–$40k and support GAAP gross margins above 73%. Management plans annual advanced‑AI chip rollouts through 2027 (Blackwell Ultra, Vera Rubin series), reinforcing its compute lead, but the 10‑Q reveals a material customer concentration risk: four direct customers accounted for 61% of fiscal Q3 revenue (22%, 15%, 13%, 11%), up from 36% a year earlier—an exposure that could meaningfully affect revenue if any top OEM/hyperscaler stalls. Investors should weigh exceptional pricing power and product leadership against elevated counterparty concentration when positioning in NVDA.
Market structure: Nvidia (NVDA) is the clear incumbent in high‑compute GPUs (>90% share in high‑compute data centers) and is extracting outsized pricing (GPU ASPs $30k–$40k; GAAP gross margin ~73%). Direct winners are hyperscalers (AMZN, MSFT, GOOGL) and select OEMs/systems integrators (SMCI, Quanta, Foxconn); losers are fringe GPU competitors and any legacy CPU‑centric suppliers that can’t match CUDA ecosystem lock‑in. The immediate supply/demand picture is tight — multi‑quarter backlogs — but concentrated demand (61% of revenue from four direct customers) amplifies idiosyncratic counterparty risk.
Risk assessment: Tail risks include loss of a single top customer (~22% revenue concentration), broader hyperscaler capex pullback (>10% sequential cloud capex cut would materially hit NVDA sales), geopolitically driven export controls to China, or a manufacturing yield/wafer supply shock. Time buckets: days — heightened IV and possible 8–15% swings around filings; weeks/months — inventory digestion and OEM shipment timing; quarters/years — competitive catch‑up or vertical integration could compress NVDA margins. Hidden dependency: Nvidia’s revenue is a function of a few hyperscalers’ procurement cadence, not broad enterprise adoption; second‑order effect is amplified cyclicality for NVDA relative to diversified cloud vendors.
Trade implications: Tactical: small, hedged long exposure to NVDA using 9–15 month call LEAPs (15–25% OTM) sized 1–2% portfolio with 3–6 month 20% OTM protective puts (~cost cap 1–2%). Pair trade: long diversified cloud software/cloud infra (MSFT, AMZN) 2–3% vs short concentrated OEMs/SMCI 1–2% to express risk that hyperscalers internalize or shift suppliers. Options: sell covered calls on part of long position to monetize elevated IV; consider buying 60–120 day strangles around quarterly releases only if IV cost <6% of notional.
Contrarian angles: The market understates the value of concentrated, recurring hyperscaler demand — if these four customers build multi‑year clusters, revenues become more predictable and defensible, supporting a higher intrinsic multiple. Conversely, consensus may underprice the event of a single large customer slowdown: a >20% revenue loss in a quarter would justify a >30% drawdown in NVDA equity in the near term. Historical parallel: dominance cycles (Intel in CPUs) show fast rises and sharp share losses once ecosystems fragment; watch for early signs of alternative stacks or customer vertical integration as the ultimate inflection.
AI-powered research, real-time alerts, and portfolio analytics for institutional investors.
Request DemoOverall Sentiment
mixed
Sentiment Score
0.05
Ticker Sentiment
