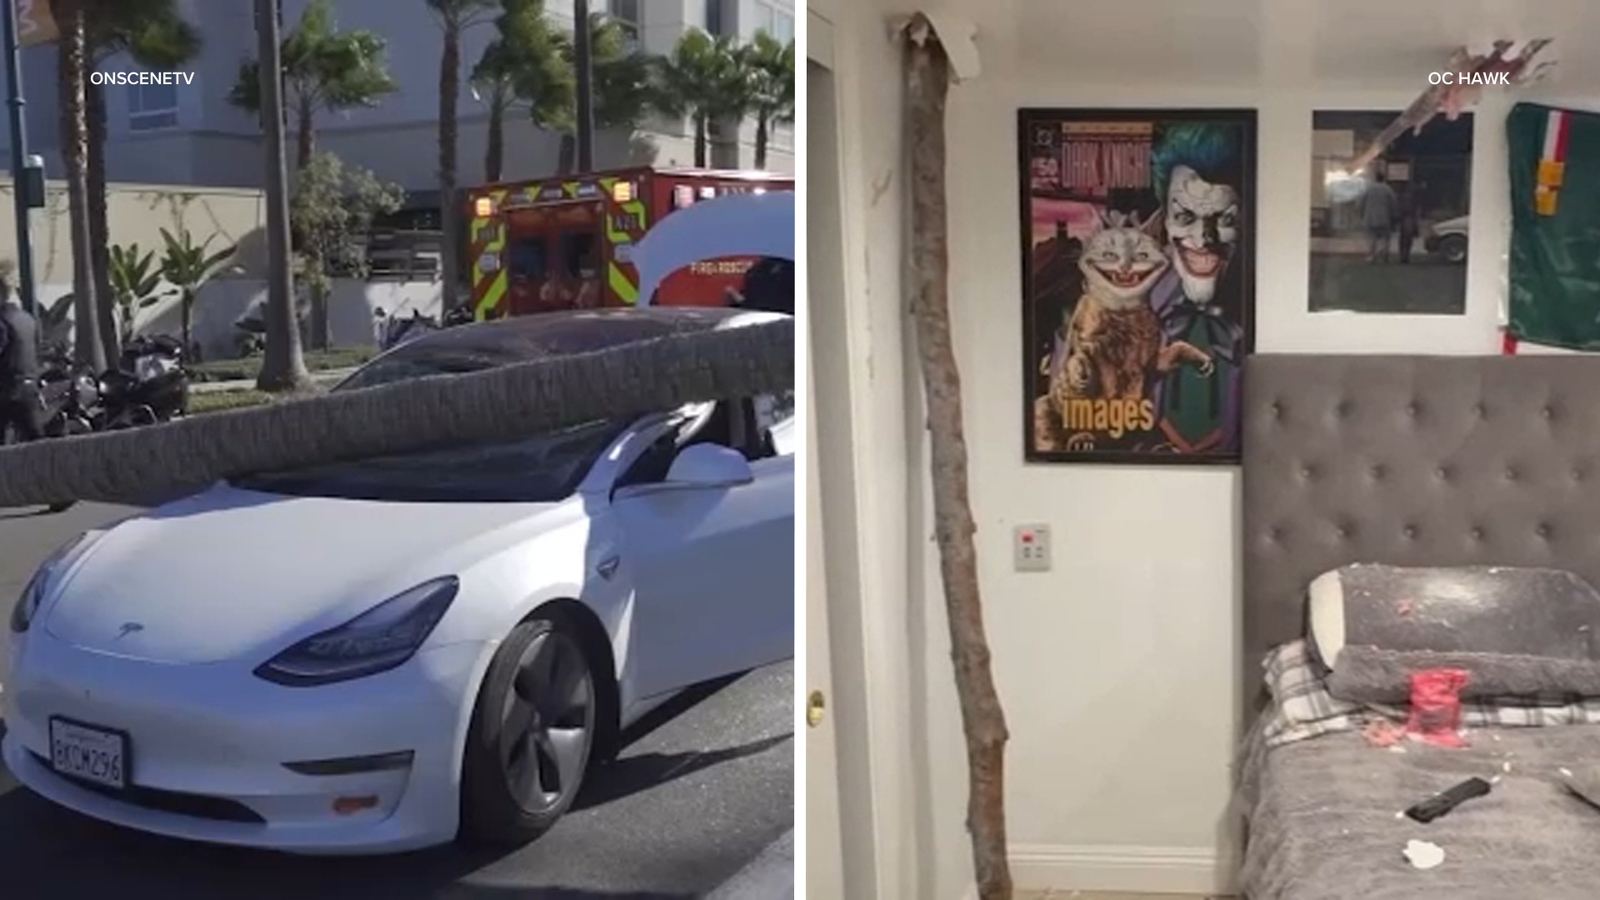
Strong Santa Ana winds across Southern California produced gusts forecast at 25–40 mph with peaks to 60 mph, causing downed trees, power-line damage, vehicle and residential damage and at least one reported injury; wind advisories have since expired. Local infrastructure and transportation disruptions were reported — freeway debris, closed SR-118, and power-line entanglements — creating short-term operational risk for utilities, insurers and local road traffic. Impacts are largely localized and not expected to be market-moving, but managers should note potential small, transient effects on regional insurance claims, utility service restoration costs and near-term logistics in affected counties.
Market structure: Near-term winners are home-repair and storm-equipment plays (HD, LOW, GNRC) and T&D contractors (PWR) as localized demand for tree removal, roofing, generators and grid repairs rises 5–15% in affected ZIP codes over the next 4–8 weeks. Losers include CA-exposed utilities (EIX) and homeowner insurers (TRV, ALL, CB) from accelerated claims and potential wildfire ignition; expect 30–90 day implied volatility bumps of 20–40% in those tickers. Cross-asset: municipal paper in affected counties could see small spread widening (<20bp); reinsurer/insurer credit spreads may cheapen, presenting short-term CDS/credit opportunities.
Risk assessment: Tail risk is a low-probability high-loss wildfire triggered by these winds (> $1bn) that could force utility liability write-downs and regulatory intervention within 3–12 months; insurer equity downside in that scenario could exceed 20–40%. Immediate risks (days) are operations/logistics delays and localized property claims; medium-term (months) include rate filings and capex reallocation by utilities; long-term (1–3 years) is an acceleration of grid hardening spend. Hidden dependencies: reinsurance renewal dates (April–June) and state CPUC investigations can magnify impact quickly.
Trade implications: Trade tactically — buy HD/LOW (1–2% portfolio weight each) for a 4–8 week repair demand pop; implement 30–60 day call spreads to cap premium. Establish a 1% long in GNRC via a 3-month call spread to capture generator demand. Take a cautious 0.5–1% short in EIX for 6–12 months (or buy 9–12 month puts) as wildfire liability overhang; set 8% stop, 15–25% downside target. Long PWR (1% weight) for 6–24 months to play grid-hardening capex acceleration.
Contrarian angles: Consensus underweights the multi-quarter boost to T&D capex — if losses remain sub-$100m markets will rotate quickly into contractors (PWR up 15–25%); conversely the market may overprice insurer risk if damage is constrained, creating a buying opportunity in TRV/CB on >20% pullbacks. Historical analogue: 2017 CA wildfire cycle led to multi-year utility/regulatory repricing and sustained contractor outperformance. Watch thresholds: insurer equity sell-offs >20% or utility credit spread widening >75bp signal deeper systemic repricing and warrant shifting to longer-duration hedges.
AI-powered research, real-time alerts, and portfolio analytics for institutional investors.
Request DemoOverall Sentiment
mildly negative
Sentiment Score
-0.25
