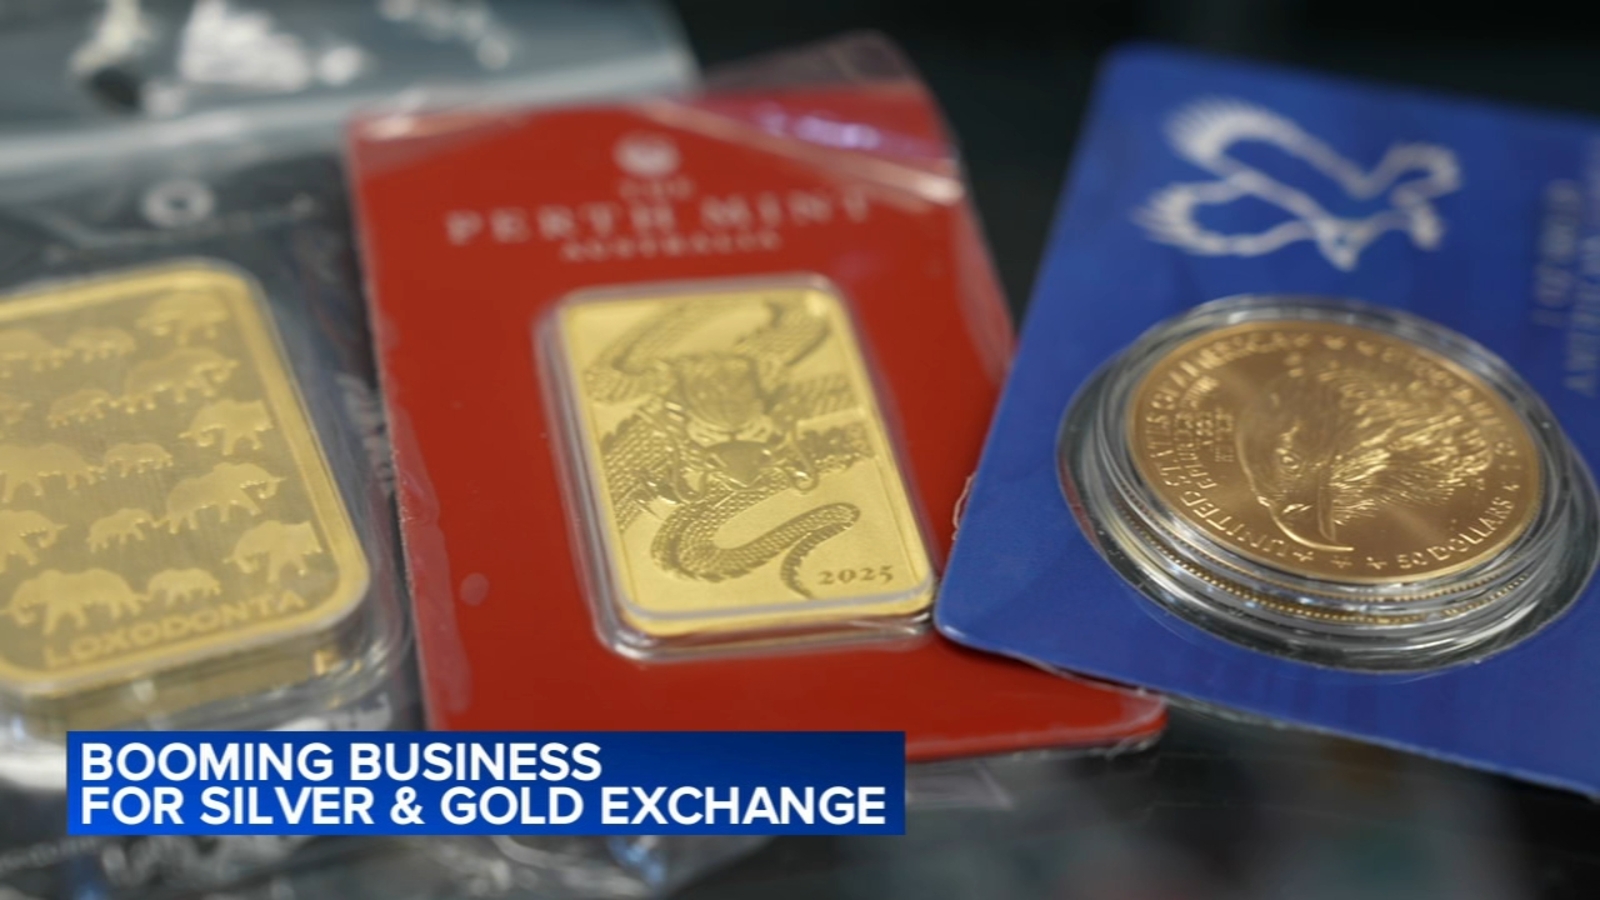
Gold futures and the physical gold market have surged, with spot gold topping $5,000 per ounce for the first time, up 15% year-to-date following a 65% jump in 2025; silver has more than doubled in recent months. The rally is generating increased household selling and retail activity—dealers reporting walk-in traffic rising from ~20 to 50+ inquiries per day and individual transactions of several thousand dollars—which may boost secondary-market supply and dealer volumes and is relevant for positions in bullion, miners, and physical metal flows. Dealers advise sellers to verify purity and work with reputable buyers (XRF testing cited) as heightened retail activity and traveling buyers increase counterparty risk.
Market structure: Physical gold at $5,000/oz and silver doubling in months signals retail-driven demand and strong ETF/central-bank appetite; winners are bullion ETFs (GLD, IAU), major miners (NEM, BHP, GDX) and commodity-linked currencies (AUD, CAD); losers include jewelers and pawnstore margins. Pricing power is concentrated in spot bullion and ETF suppliers; miners gain leverage but face cost and permitting constraints that cap near-term supply response.
Supply/demand and cross-asset effects: Rapid price moves imply demand outpacing recycled supply short-term (retail selling ironically increases secondary supply but lagged), while higher gold typically correlates with lower real yields and weaker USD—pressuring bond real yields and lifting commodity FX; implied vols in gold/silver options will rise, making vanilla premium expensive. Expect correlation shifts: gold up, long-duration sovereigns could rally if growth fears intensify, but hawkish Fed pivots would unwind gains.
Risk assessment and catalysts: Tail risks include sudden central-bank gold sales, abrupt USD rebound (DXY > 104) or a swift Fed rate normalization—each could produce 15-30% drawdowns in metals. Near-term (days-weeks) expect elevated intraday volatility; medium-term (3–6 months) momentum continuation is probable but vulnerable to 10–20% corrections; long-term (12–36 months) depends on real-rate trajectory and miner capex.
Contrarian angles: Market may underprice recycled supply and profit-taking; historical analog (2011 peak) shows rapid parabolic runs often retrace deeply if not backed by sustained negative real rates. Silver’s 2x move is more likely to mean-revert; miners could underperform metal if input inflation persists—look for dispersion between spot metal strength and miner fundamentals as a trade trigger.
AI-powered research, real-time alerts, and portfolio analytics for institutional investors.
Request DemoOverall Sentiment
moderately positive
Sentiment Score
0.60
