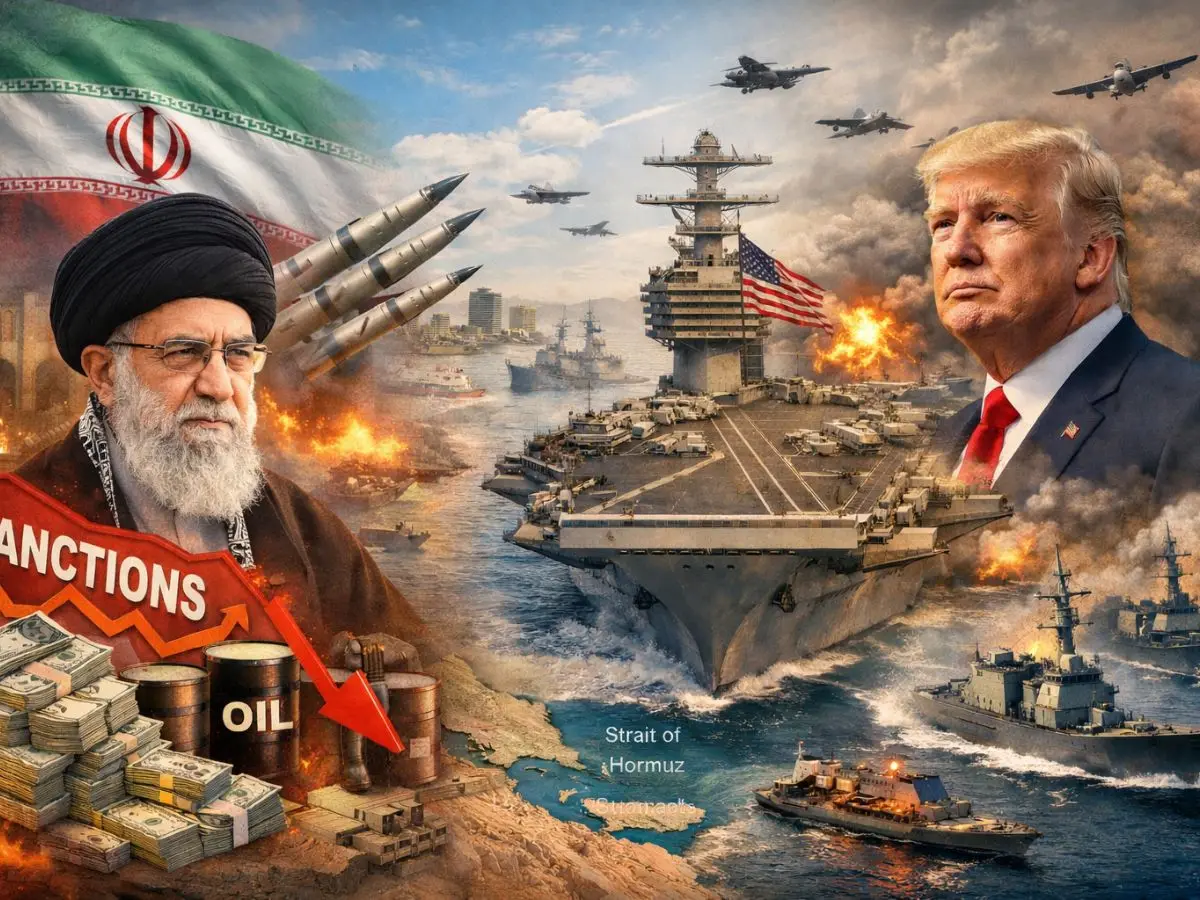
Iran has signalled conditional flexibility on its nuclear programme — offering to dilute highly enriched uranium while rejecting zero enrichment — provided the US is willing to discuss sanctions relief, even as Washington combines Treasury sanctions targeting oil exports and missile procurement with stepped-up naval deployments. The US has repositioned carrier strike groups, guided‑missile destroyers and surveillance assets to the Gulf and is preparing for possible sustained military operations, while upcoming Geneva talks aim to negotiate a deal; the standoff raises the risk premium on Gulf oil flows via the Strait of Hormuz and amplifies economic pressure on Iran's GDP and financial capacity. Investors should monitor sanctions relief signals and carrier deployments as drivers of oil-price volatility, regional risk premia, and potential disruptions to energy trade and emerging‑market sentiment.
Market structure: Near-term winners are large integrated energy producers (XOM, CVX; also XLE ETF) and defence primes (LMT, NOC, RTX) as pricing power and contract wins rise if tensions persist; losers include regional EM credits, travel & leisure (AAL, CCL) and insurers tied to tanker/war risk. Expect Brent volatility: a Strait of Hormuz disruption could add $10–40/bbl within days; sustained sanctions raise container/tanker freight and insurance costs, compressing refining cracks regionally. Cross-asset: USD and gold should appreciate on risk‑off, EM FX and regional sovereign spreads widen 50–200bps, and US Treasury yields may fall 10–30bps in a flight-to-safety then reprice higher if oil inflation persists.
Risk assessment: Tail risks include rapid escalation to kinetic strikes on oil infrastructure causing oil >$120/bbl and a 5–15% equity drawdown within days, or conversely fast sanctions relief that drops oil 15–25% in weeks. Short-term (days–weeks) is dominated by headline-driven volatility; medium-term (1–3 months) by sanctions mechanics and shipping insurance cycles; long-term (quarters–years) by capex shifts and US shale response. Hidden dependencies: insurance rerouting increases voyage time/costs, China’s demand trajectory will mute or amplify shocks, and secondary sanctions could freeze liquidity for non-US counterparties. Key catalysts: Geneva talks (0–30 days), US carrier movements/incident reports (days), formal sanctions changes (30–90 days).
Trade implications: Tactical positions: 1) Establish 2–3% long in XOM and 1–2% in CVX via 3‑month buy‑write or call spread structures (buy 3‑month ATM+15% call / sell ATM+30%) to cap cost; enter within 48–72hrs and trim if Brent < $75 for two weeks. 2) Add 2–3% long in LMT or buy 6‑month calls (10–15% OTM) for defense upside; target 15–25% nominal upside or exit if bipartisan de‑escalation confirmed. 3) Short travel exposure: 1–2% net short in AAL/CCL or buy 3‑month puts; cover if oil falls >15% or Geneva yields clear sanctions relief. 4) Hedge tail risk with 1–2% GLD or long-dated Brent call spread (buy $85/$120, 6–9 months).
Contrarian angles: Markets often overshoot; if talks in Geneva produce credible sanctions relief within 30–90 days, energy/defense could mean‑revert 15–30% — historical parallel: post‑JCPOA oil fell ~20% in months. Don’t assume sustained high oil; rising US shale (response threshold ~$80–85/bbl sustained for 3–6 months) will cap upside. Unintended consequences: higher freight/insurance will accelerate energy substitution and LNG contracting changes, creating losers among short‑dated tanker play and winners in alternative fuel infrastructure. Consider a volatility fade: sell excessive 1–2 month crude or energy single‑stock IV if it rises >50% vs 60‑day average, but size small (0.5–1%).
AI-powered research, real-time alerts, and portfolio analytics for institutional investors.
Request DemoOverall Sentiment
moderately negative
Sentiment Score
-0.35
