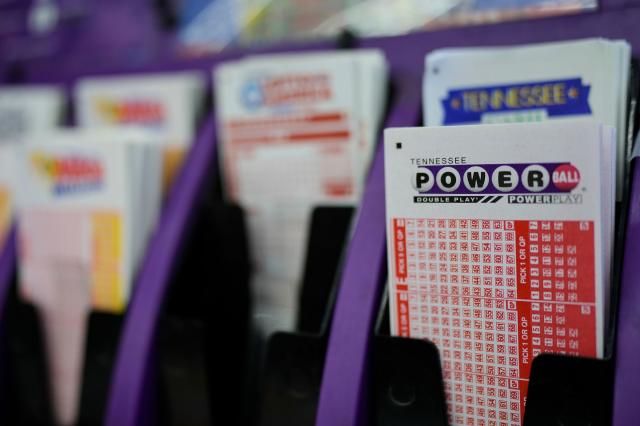
The Powerball jackpot has climbed to an estimated $1.6 billion for the Monday drawing after no grand-prize winner in Saturday’s drawing (the 46th in the current run), marking the fourth-largest Powerball prize and fifth-largest U.S. lottery jackpot; the annuitized prize is $1.6 billion with a lump-sum option of about $735.3 million. While the jackpot went unclaimed, seven tickets in California, Florida, Iowa, Massachusetts, Michigan, New Hampshire and Ohio matched all five white balls for $1 million each, there were 112 $50,000 winners and 22 $150,000 winners, and a New Jersey ticket won $500,000 in a Double Play drawing; the jackpot odds are 1 in 292.2 million and drawings occur Monday, Wednesday and Saturday—an event with negligible direct market implications.
Market structure: A $1.6B Powerball run is a demand shock for state lotteries, convenience retailers and media (eyeballs) while leaving game economics unchanged (ticket price fixed at $2; Double Play $1). Winners: retailers with high lottery SKU share (fuel/convenience, e.g., CASY, private 7‑Eleven franchisees), state treasuries via higher receipts, and broadcast/streaming news outlets for 48–72 hours of heightened traffic. Losers: small discretionary merchants that compete for the same impulsive spend and any merchant margins that rely on repeat non‑ticket SKUs if ticket buyers substitute purchases.
Risk assessment: Tail risks are regulatory (state hearings on commissions or advertising limits), an immediate jackpot winner collapsing ticket demand, and fraud/operational outages at point‑of‑sale. Time horizons: immediate (days) — pronounced foot‑traffic and SSS spikes around drawings; short (weeks) — reversion if jackpot won; long (quarters) — negligible structural demand shift unless policy changes. Hidden dependencies include state‑by‑state rules on lottery sales and retailer commission schedules; catalyst set = media hype, progressive jackpot size, and winner announcements.
Trade implications: Tactical alpha lies in short‑dated, event‑driven retail/convenience exposure and avoiding longer‑term media bets. The highest expected info edge is POS/Sales delta in the 48–72 hours pre/post drawing; price impact should be concentrated in small/mid caps with high lottery revenue share (higher gamma in options). Volatility for short‑dated retail options will skew up pre‑draw and collapse post resolution; plan directionally sized, defined‑risk option structures.
AI-powered research, real-time alerts, and portfolio analytics for institutional investors.
Request DemoOverall Sentiment
neutral
Sentiment Score
0.00
Contrarian angle: Consensus treats this as a feel‑good, transient consumer boost — that is mostly correct, so long holdings in large-cap diversified retailers are likely overpaid for this effect. The mispricing opportunity is concentrated, short‑duration exposure to specialist convenience operators (higher lottery revenue sensitivity) rather than broad retail or media names. Historical parallels (2016–2023 mega jackpots) show 24–72 hour POS bumps that revert within one week; regulatory backlash is a low‑probability, high‑impact risk to monitor.
