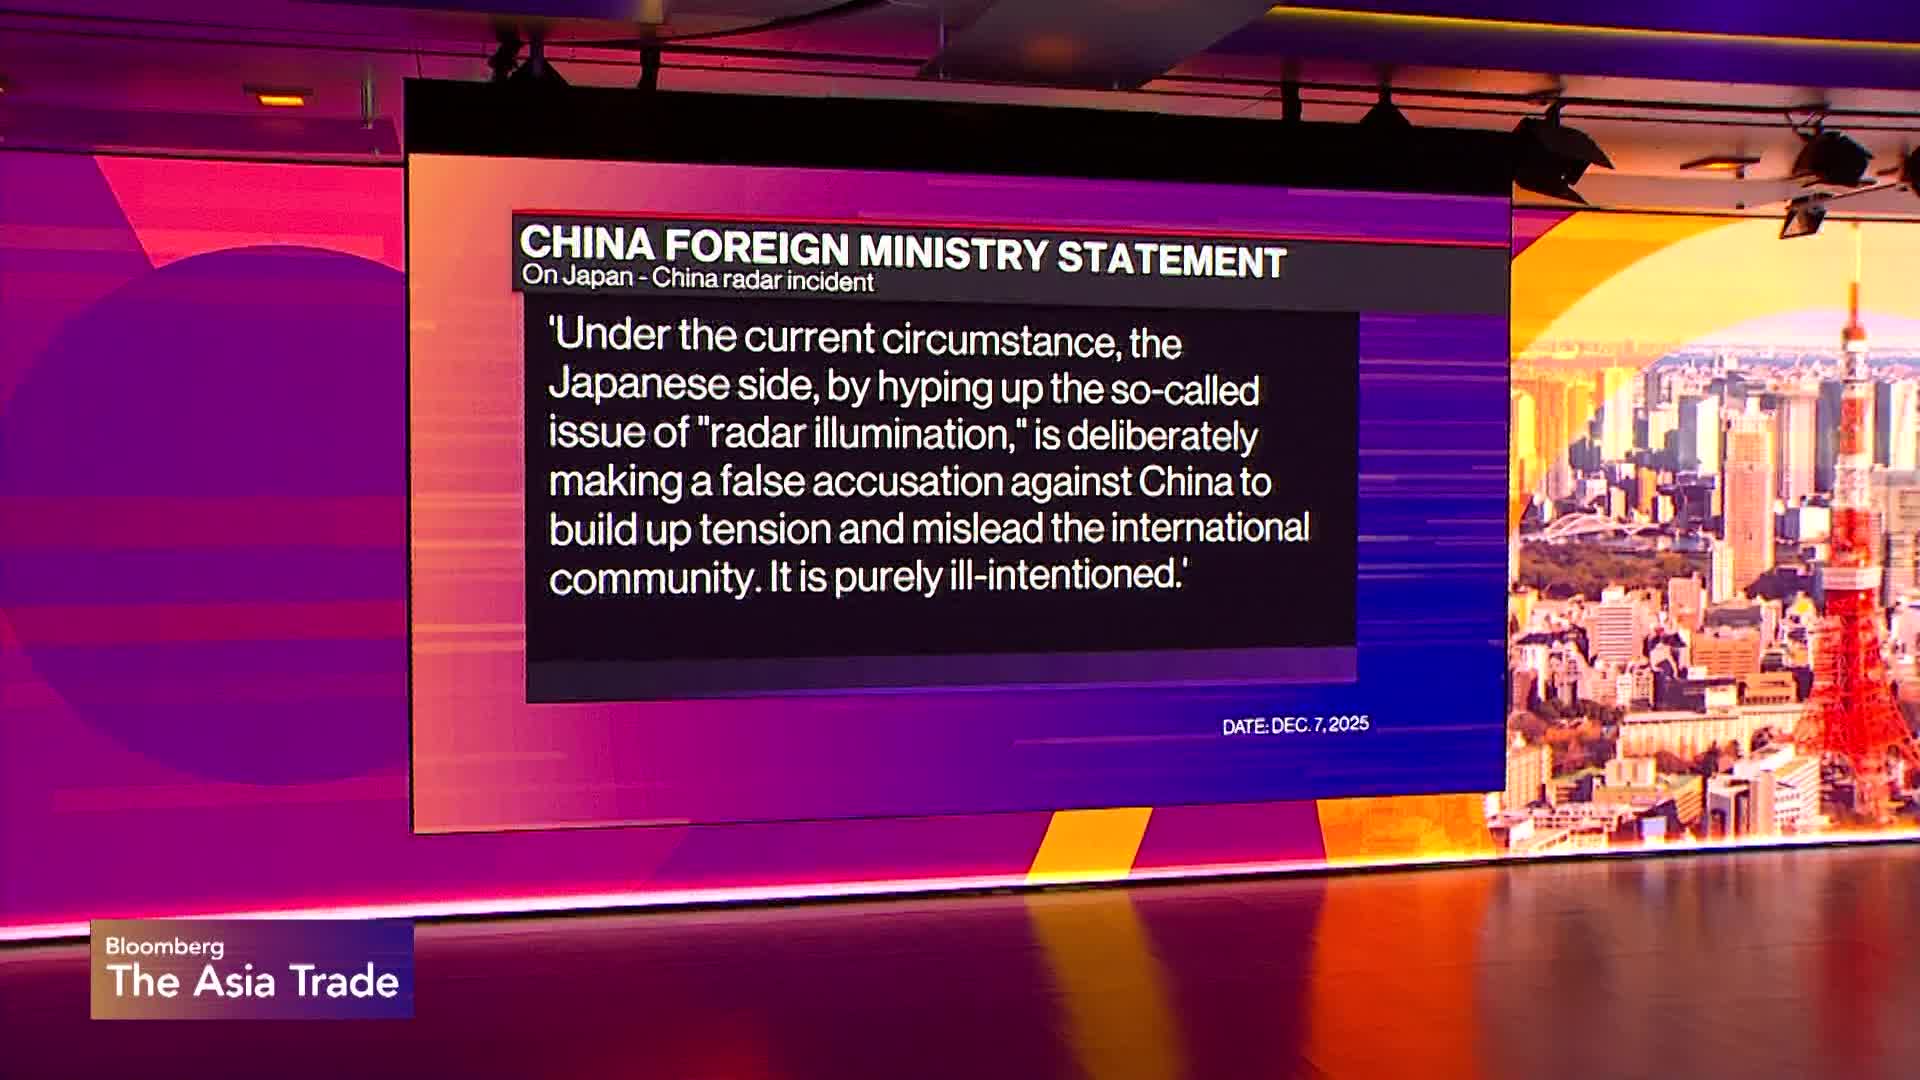
Japanese and Chinese forces reported conflicting accounts of a close-contact incident near Okinawa after Japan scrambled F-15s saying Chinese J-15s approached Japanese airspace over international waters and allegedly used fire-control radar; China denies the claim, says Japan is hyping the issue and demands an apology and retraction related to recent Japanese comments on Taiwan. Tokyo lodged a formal protest and warned of measures to prevent recurrence, leaving elevated bilateral tensions and heightened tail risk for regional markets and defense-related assets.
Market structure: Near-term winners are defense primes and ETFs (LMT, RTX, NOC, ITA) and commodity safe-havens (gold, oil) as risk premia rise; losers are regional tourism, airlines, and Asian exporters with just‑in‑time China exposure. Expect a 5–15% intraday volatility lift in regional FX and equity indices on repeat air-incursion events and a 10–30% relative outperformance of defense vs. cyclicals over 3–12 months if government procurement rhetoric turns fiscal.
Risk assessment: Tail risks include miscalculation leading to a localized military clash (low prob <5% next 12 months but >15% over 3 years if incidents multiply), heavy sanctions, or supply‑chain decoupling accelerating. Immediate (days) = tactical flight to quality (JPY, TLT, gold), short-term (weeks–months) = elevated VIX and widening Asian credit spreads, long-term (quarters–years) = structural lift to defense budgets and reshoring capex.
Trade implications: Favor 3–9 month directional long exposure to defense (buy LMT/RTX or 2–3% portfolio allocation to ITA) and tactical long GLD (1–2%) as a hedge; consider 3–6 month call buys (LMT Jan 2026 455C or RTX Jan 2026 105C) sized 0.5–1% portfolio. Hedge regional equity exposure with short EWJ puts or buy protection on TOPIX if incidents exceed 3/week; short spot JPY only if Japan-specific political risk (PM comments re: Taiwan) spikes volatility for >2 trading days.
Contrarian angle: Consensus may overpay defense equities on headlines — if headline frequency doesn’t increase (threshold: ≤1 incident/week for 4 weeks) expect 5–10% mean reversion sell‑off; history (2010 Senkaku) shows prolonged political friction without kinetic escalation, so buy dips in 3–6 month window rather than chase spikes. Watch procurement timelines — wins take 12–36 months to materialize, so prefer options and ETFs for tactical exposure and select suppliers with order backlog visibility to avoid overpaying hype.
AI-powered research, real-time alerts, and portfolio analytics for institutional investors.
Request DemoOverall Sentiment
moderately negative
Sentiment Score
-0.40
