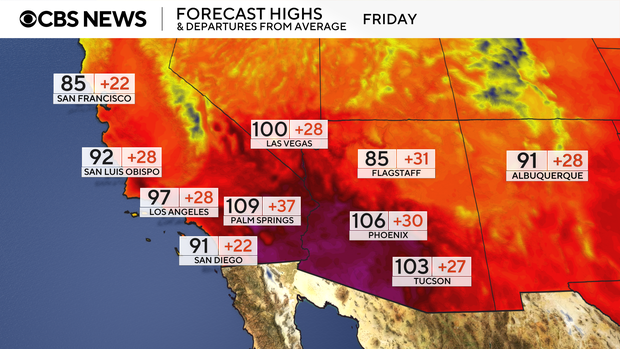
More than 600 record-breaking daily high and overnight low temperatures are forecast through the first half of next week, with Phoenix expected to record its earliest 100°F day on record (earlier record March 26, 1988). The prolonged West-wide heat wave and active heat advisories (through at least Sunday) will likely boost near-term electricity/cooling demand and stress local grids and public health services, with elevated heat-related risk for populations and insurers in affected metro areas (San Francisco, LA, San Diego, Palm Springs, Las Vegas, Phoenix, Tucson). Monitor power prices and utility load forecasts for the Desert Southwest and coastal interior markets; impacts are likely localized but could widen if advisories are extended.
Expect an acute reshaping of short-term power and gas curves: earlier-season cooling demand will lift late-week day‑ahead prices in CAISO and Southwest hubs and increase utilization of fast‑start gas peakers, mechanically steepening near-term gas forwards vs. summer strip by a few percent. That creates a narrow window (days–2 weeks) where volatility in prompt power and gas will exceed options-implied moves — useful for selling premium or buying short-dated directional exposure. Water and agricultural stress is a less visible but faster channel into real cashflows: accelerated irrigation and urban water use will push local utility operating costs and may force temporary pumping curtailments, compressing margins for irrigated specialty crops and processors in the coming month. Healthcare utilization (heat-related ER visits, OTC cooling products) and retail demand for fast-moving consumables will show a measurable sales bump in Southwest zip codes over 7–21 days, benefiting distribution-heavy retailers that can restock quickly. The medium-term (3–18 months) implication is an acceleration of capex and regulatory moves toward demand response, retrofit HVAC financing, and rooftop/storage economics; manufacturers and ESCOs with installation capacity will reprice orderbooks. Tail risk is twofold: a quick meteorological reversion would blow off near-term trades, while repeated events raise insurance loss frequency and political pressure for rate design — both catalysts to monitor for policy-driven revenue shifts for utilities and insurers.
AI-powered research, real-time alerts, and portfolio analytics for institutional investors.
Request DemoOverall Sentiment
neutral
Sentiment Score
-0.05