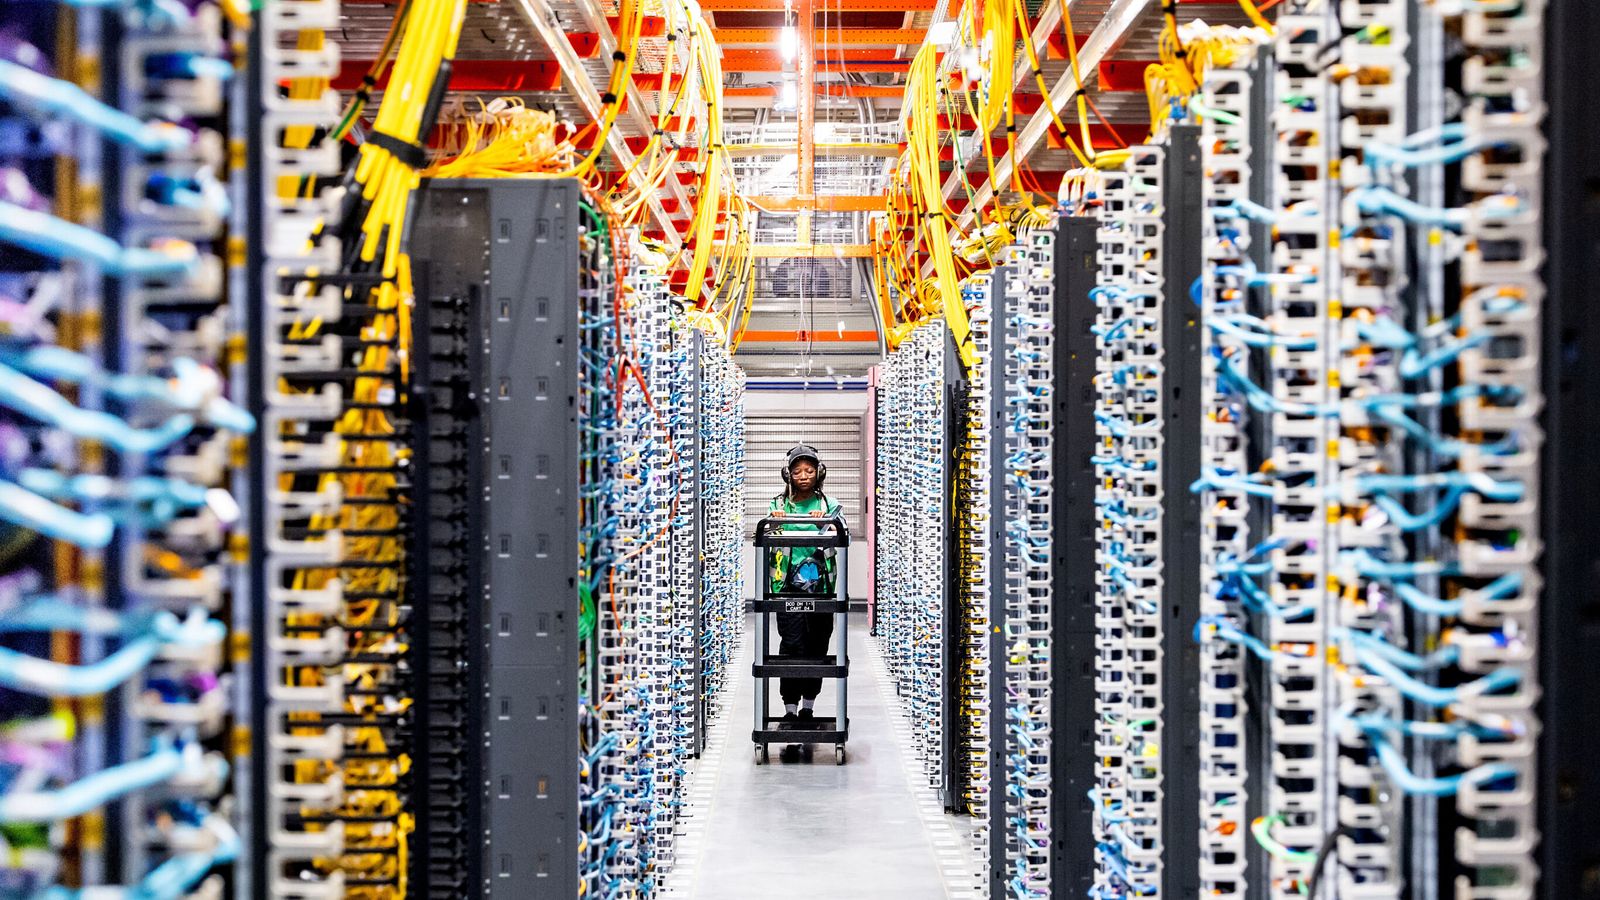
US equity returns are highly concentrated in AI-related names (41 AI stocks driving 75% of S&P500 returns; the 'magnificent seven' account for 37%), while big tech and AI players plan roughly $1tn of AI spending by 2026 and OpenAI has signalled $1.4trn of commitments over three years. Current revenue signals are far smaller — OpenAI is expected to make ~ $20bn profit in 2025 and only ~5% of its 800m weekly users are paying — and adoption among firms remains low (8–12% overall, ~12–14% for larger companies), raising concerns that trillion-dollar capex will not be matched by profits. Structural risks cited include rapid depreciation of AI chips (replacement cycles possibly 2–3 years, with estimated market-cap write-downs of $780bn–$1.6trn for top tech firms), massive new data‑centre power demand, and potential wider banking/liquidity knock‑on effects if the AI investment narrative reverses.
Market structure: Winners near-term are chipmakers (NVDA, CRWV) and data‑centre builders plus power/industrial suppliers as capex remains high; losers are margin‑sensitive hyperscalers (MSFT, AMZN, GOOGL, META) if revenue fails to scale to capex. Concentration risk is extreme — 41 AI names drive 75% of S&P returns and the “Magnificent Seven” 37% — raising liquidity and correlation risks if one leader re-rates. Supply/demand for top‑tier GPUs remains tight short term but accelerated depreciation (3y→2y) can flip that into oversupply within 12–36 months, compressing chip pricing power.
Risk assessment: Tail risks include a rapid re‑rating causing corporate credit stress and constrained bank liquidity (months), regulatory export controls or utility curtailments (quarters), or a technical plateau in LLM scaling that forces write‑downs (1–3 years). Hidden dependencies: OpenAI/NVDA roadmaps, grid permitting and long lead times for generation capacity; venture pullback would quickly reduce downstream demand and M&A exits. Key catalysts to watch: NVDA earnings/guide, hyperscaler capex cadence, OpenAI monetization metrics and US grid interconnection delays over the next 3–9 months.
Trade implications: Implement hedged shorts on high‑beta AI exposure and longs in durable cash‑generative enterprise tech and infrastructure. Use put spreads (3–12m) on NVDA/MSFT/META to buy tail protection rather than outright shorts; pair trades (long ORCL, short MSFT) capture relative capex/earnings durability. Rotate 3–5% into utilities/energy infra and commodities (copper, power) to monetize grid strain and data‑centre buildouts over 6–24 months.
Contrarian angles: The market underestimates two outcomes — (1) sustained NVDA pricing power if competitors lag, making short NVDA highly convex risk, and (2) faster monetization via AI SaaS that could compress payback to 3–5 years if enterprise adoption accelerates. History: telecom overbuilds (2000s) destroyed equity but rewarded survivors; expect dispersion — avoid binary platform calls and prefer asymmetrical, capped‑loss option structures. Unintended consequence: aggressive repricing could force hyperscalers to monetize rapidly, shortening the pain period and producing sharp rebounds.
AI-powered research, real-time alerts, and portfolio analytics for institutional investors.
Request DemoOverall Sentiment
strongly negative
Sentiment Score
-0.60
Ticker Sentiment
