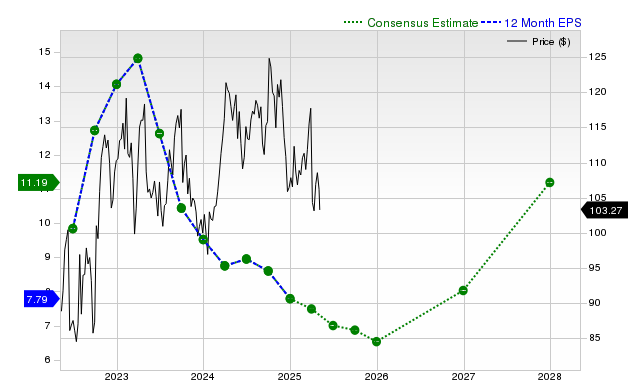
Zacks shows Exxon Mobil with a current-quarter consensus EPS of $1.62 (-3% YoY; consensus down 1.4% in 30 days), fiscal-year EPS $6.88 (‑11.7%; +1% in 30 days) and next fiscal-year EPS $7.33 (+6.5%; -2.4% in 30 days). Consensus sales are $86.0B for the quarter (+3.1% YoY) with fiscal-year sales of $333.88B (‑4.5%) and $340.18B next year (+1.9%). In the last reported quarter Exxon posted revenue of $85.29B (‑5.2% YoY) and EPS of $1.88 (vs $1.92 a year ago), missing revenue consensus by 1.7% but beating EPS by 3.87%; Zacks assigns a Rank #3 (Hold) and a Value Style Score of B, while shares returned +0.1% over the past month versus the S&P -0.8% and industry -1%.
Market structure: Integrated supermajors (XOM, CVX) are beneficiaries of a stable cash-flow backdrop, dividend yield and buyback optionality when crude trades above $70–$80/bbl; small-cap E&Ps and oil services lose pricing power as capex discipline and scale concentrate free cash flow in the majors. Consensus EPS for XOM (current qtr $1.62; FY $6.88) implies muted near-term growth, so market-share gains will come from capital allocation not production growth. Cross-asset: stronger oil -> higher headline CPI expectations, upward pressure on 10y yields (bear steepening), stronger CAD/NOK vs USD cyclicals, and elevated commodity vols that widen energy equity options spreads.
Risk assessment: Tail risks include an abrupt demand shock from accelerated EV adoption or major climate regulation (>$30bn of writedowns scenario) and operational shocks (large refinery incident) that could cut free cash flow >20% in a quarter. Time horizons: immediate (days) — volatility around earnings and OPEC headlines; short-term (weeks/months) — estimate revisions and buyback announcements; long-term (yrs) — structural demand trajectory. Hidden dependencies: downstream petrochem margins and buyback execution matter more than headline production; catalytic triggers: Brent move ±$10 within 60 days or 5% consensus EPS revision.
Trade implications: Tactical overweight XOM via equities and collars; consider 12-month bullish call spreads if Brent >$85 for convexity. Pair trade: long XOM vs short growth (NVDA) if macro repricing/real yields rise; use 3–6 month horizons and size 1:0.6. Use covered calls to harvest yield if holding long; avoid levered oil services exposure.
Contrarian angles: Market may underprice integrated resilience — XOM’s B value grade + consistent EPS beats suggests downside is limited absent an oil demand collapse; conversely, consensus underestimates a rapid multiple contraction if global growth weakens, which would hit NVDA/growth harder than XOM. Historical parallel: 2014–16 oil cycles show majors re-rating later as capex discipline restored cash returns. Unintended risk: crowding into “safe” energy longs could push valuation premium; watch flows and implied vol spikes.
AI-powered research, real-time alerts, and portfolio analytics for institutional investors.
Request DemoOverall Sentiment
neutral
Sentiment Score
0.00
Ticker Sentiment
