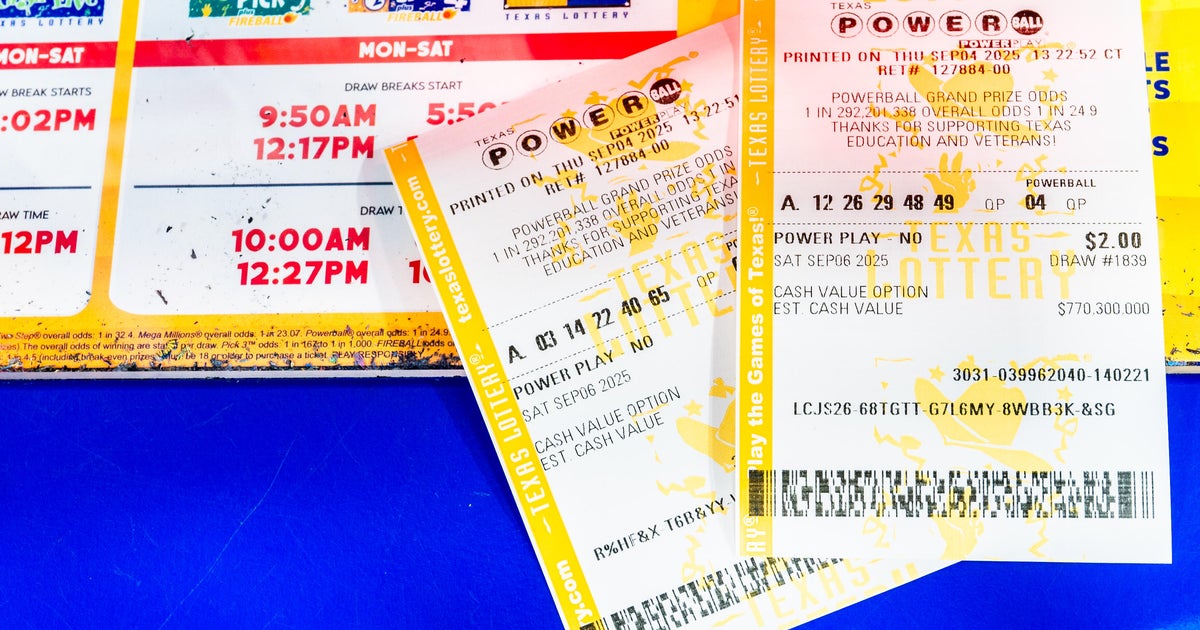
Powerball drew numbers 25, 33, 53, 62 and 66 with a Powerball of 17 for an estimated $1.25 billion jackpot, the sixth-largest in game history, with an estimated lump-sum cash value of $572.1 million. It was the 44th straight drawing since the last jackpot was won, marking Powerball's longest run without a top-prize winner; a single winner can elect the cash or a 30-year annuity (first payment now, 29 annual payments rising 5% annually). Odds of winning the top prize remain 1 in 292.2 million, and tickets are sold in 45 states plus DC, Puerto Rico and the U.S. Virgin Islands at $2 per play.
Market structure: Large jackpots directly benefit state lotteries (higher ticket volume → near-term cash inflows to state treasuries), brick-and-mortar retail (convenience stores, grocery front-ends, gas stations) and broadcasters (ad/PR lift). For a $1.25bn headline prize (cash ~$572m) expect incremental ticket sales in the low-to-mid hundreds of millions over the 7–14 day run-up, reallocating a few hundred basis points of consumer wallet away from discretionary online purchases. Competitive dynamics are transient — market share shifts toward physical retail for 3–10 days, not a durable pricing-power change for national chains.
Risk assessment: Tail risks include regulatory backlash (state audits, higher lottery taxes or caps) and an operational failure (miscounted winners) that could trigger litigation and reputational costs; probability low but impact material for lottery operators and state budgets. Time horizons: immediate (0–14 days) sees sales/traffic spikes; short-term (1–3 months) normalizes; long-term (quarters+) no structural demand change absent policy. Hidden dependency: jackpot winners’ lump-sum allocation can drive concentrated local real-estate, private banking and short-term equity flows; watch for clustered deposit inflows into regional banks.
Trade implications: Tactical, size-constrained plays favor short-dated consumer-retail exposure: small call-spread buys on WMT and COST (2–4 week expiries) to capture a 0.5–2% sales bump; reduce 1–2% positions in gaming/sports-betting names (PENN, DKNG, MGM) for 2–8 weeks anticipating mild spend diversion. Use defined-risk option structures (vertical call spreads) not naked delta; sizing 0.5–2% portfolio per trade. Monitor state bond issuance windows for potential short-term supply shifts.
Contrarian angles: Consensus underestimates the brevity of the effect — many investors overpay for durable consumption uplift; historical parallels (big jackpots 2016–2022) show spikes reverse inside two weeks. Mispricing risk: short-dated calls on national retailers are likely underpriced for this event window; overexposure risk: owning gaming/secular retail on the assumption of sustained lift is likely overdone and should be avoided until post-draw sales data confirm traction.
AI-powered research, real-time alerts, and portfolio analytics for institutional investors.
Request DemoOverall Sentiment
neutral
Sentiment Score
0.00
