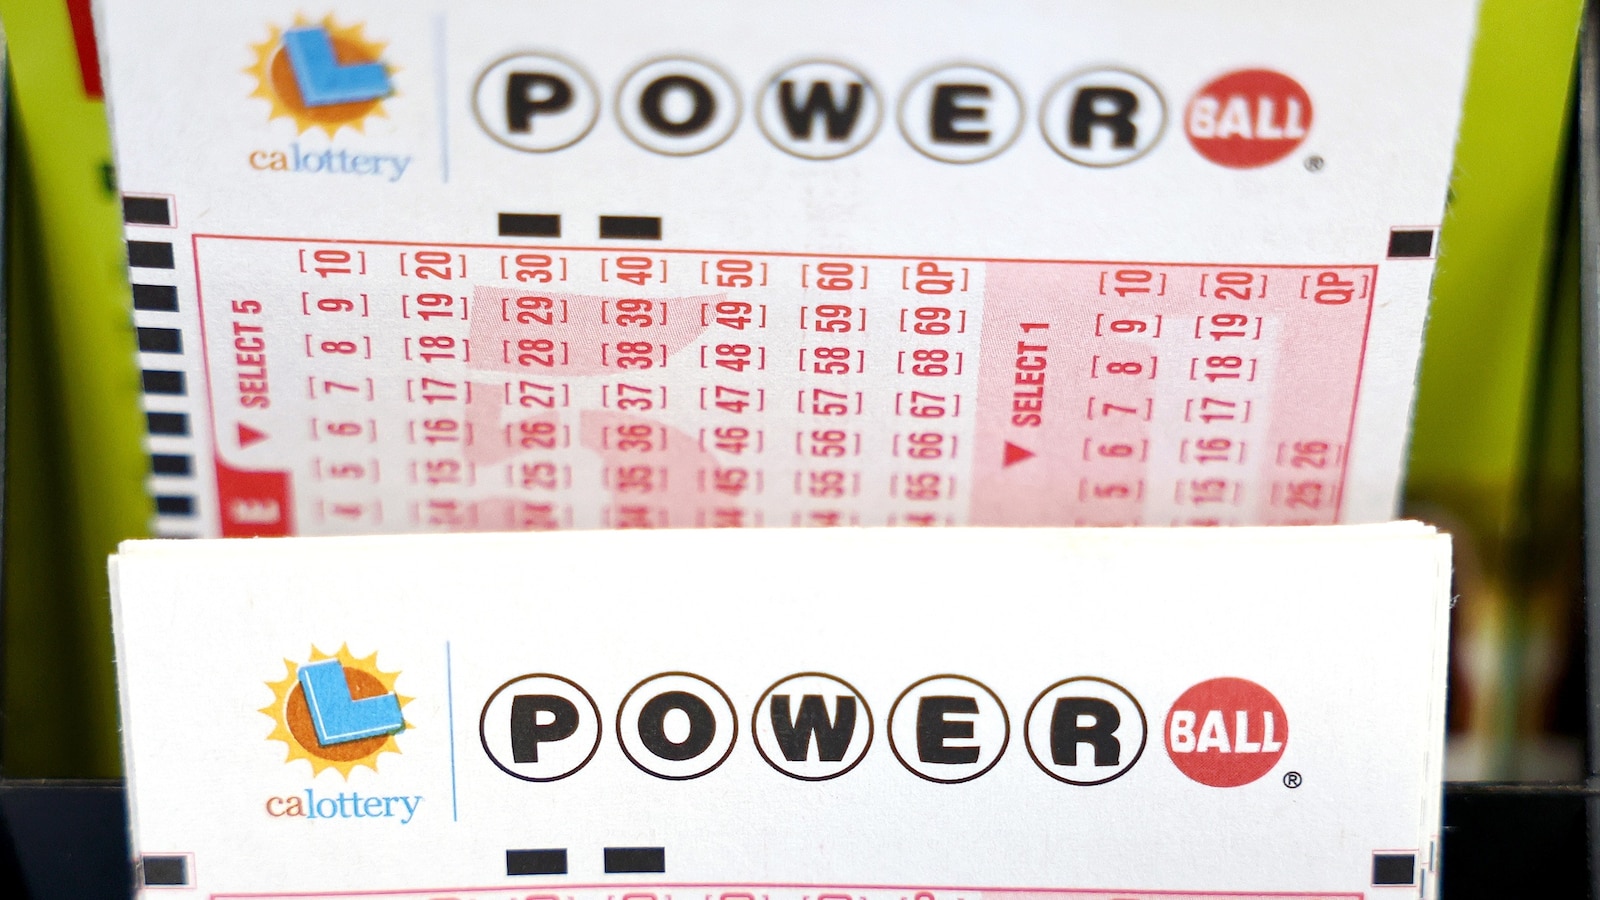
The Powerball jackpot has risen to an estimated $875 million after no ticket won Saturday's drawing (winning numbers 13, 14, 26, 28, 44; Powerball 7), making it the second-largest prize this year and the seventh-largest in game history; the next drawing is Dec. 8. The advertised prize equates to a $403.6 million lump-sum before taxes, with odds of roughly 1 in 292 million, and Powerball notes it has generated about $36 billion for charitable causes since 1992.
Market structure: A giant Powerball draw is a transitory demand shock that directly benefits lottery systems/providers (IGT, SGMS), high-frequency retail lottery sellers (Casey’s CASY, WMT, KR) and broadcast partners who monetize draw viewership. Losers are marginal — online sportsbooks (DKNG, PENN) that compete for discretionary gambling dollars may see a temporary allocation away from sports/prop bets; payment processors see minor volume blips. Expect a 1–6 week uplift in point-of-sale foot traffic and lottery terminal transactions; historical comparable jackpots show 20–50% spikes in lottery receipts in the run-up to the draw.
Risk assessment: Tail risks include regulatory pushback (state-level limits on aggressive cross-promotions), operational outages at lottery vendors, or a disputed claim that produces litigation — low-probability but could knock 10–30% off vendor equities. Immediate (days): sales/foot-traffic spike and viewership; short-term (weeks): revenue recognition for vendors and retail; long-term (quarters): negligible structural change unless jackpots become frequent and change participation habits. Hidden dependencies: state budget timing (lottery inflows tied to fiscal reporting) and retail margin capture on ancillary purchases (tobacco, snacks) that drive true profitability.
Trade implications: Tactical longs: IGT and SGMS (small sizes) to capture terminal/software volume; retail convenience exposure via CASY for 1–3 week re-rating tied to incremental basket spend. Pair trade: long IGT (1–2% portfolio) vs short DKNG (0.5–1%) over 2–6 weeks to play rotation into lottery retail vs sports betting. Options: prefer 30–60 day call spreads on IGT/SGMS to cap downside and exploit expected post-draw IV pickup; set profit targets at +15–25% and stop losses at -8–10%.
Contrarian/second-order: Markets underprice recurring jackpot tailwinds to lottery tech vendors — multiple mega-jackpots per year could lift recurring transaction fees and terminal upgrades by mid-single digits annually. Conversely, the reaction may be overdone if investors extrapolate one-off volume spikes into permanent growth; monitor state weekly lottery receipts within 72 hours and vendor volume guidance for confirmation. Unintended consequences include modal shifts to digital lotteries (benefiting vendors differently) or legislative responses that could compress margins over years.
AI-powered research, real-time alerts, and portfolio analytics for institutional investors.
Request DemoOverall Sentiment
neutral
Sentiment Score
0.00
