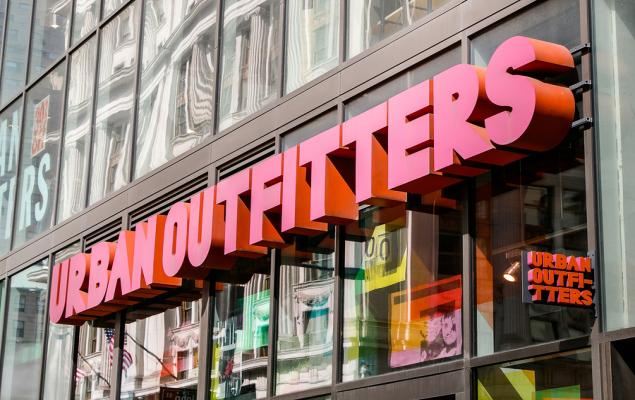
Urban Outfitters (URBN) reported a strong Q1 fiscal 2026, with gross profit rising 19.8% to $489.1 million and gross margin expanding 278 bps to 36.8%, driven by lower markdowns and reduced delivery costs. Operating income surged 72% to $128.2 million, with the operating margin increasing 340 bps to 9.6%. Management anticipates Q2 gross margin improvement of 50-100 bps and remains confident in achieving its 10% operating margin target for fiscal 2026.
Urban Outfitters Inc. (URBN) reported a robust start to fiscal 2026, with first-quarter gross profit increasing 19.8% year-over-year to a record $489.1 million, leading to a gross margin expansion of 278 basis points to 36.8%. This improvement was significantly driven by lower markdowns in the Retail segment, particularly at the Urban Outfitters brand, reduced delivery costs stemming from lower carrier rates and fewer packages per order, and improved leverage on store occupancy due to stronger comparable retail sales; excluding a one-time $4.8 million gain and the absence of prior-year impairment charges, the core margin increased by 204 basis points. Operating income surged by an impressive 72% to $128.2 million, elevating the operating margin by 340 basis points to 9.6% of sales, supported by strong full-price selling and disciplined inventory management. Management projects a further 50-100 basis point year-over-year improvement in gross margin for the second quarter, despite anticipating some pressure from reduced initial product margins due to higher U.S. tariffs, and reiterates confidence in achieving its 10% operating margin target for fiscal 2026. The company's stock has reflected this strong performance, rallying 38.4% in the past three months, significantly outperforming the Zacks Retail-Apparel and Shoes industry's 4% growth and the S&P 500's 5.2% growth. Technically, URBN trades above its 50-day ($58.41) and 200-day ($49.65) simple moving averages, indicating a continued uptrend. Valuation appears attractive, with a forward 12-month price-to-sales ratio of 0.99, below industry (1.65) and sector (1.59) averages, and a Zacks Value Score of A. Consensus earnings estimates have also seen upward revisions, with the current fiscal year EPS estimate at $4.96 (22.2% YoY growth) and sales at $6.02 billion (8.5% YoY growth).
AI-powered research, real-time alerts, and portfolio analytics for institutional investors.
Overall Sentiment
strongly positive
Sentiment Score
0.85
Ticker Sentiment
