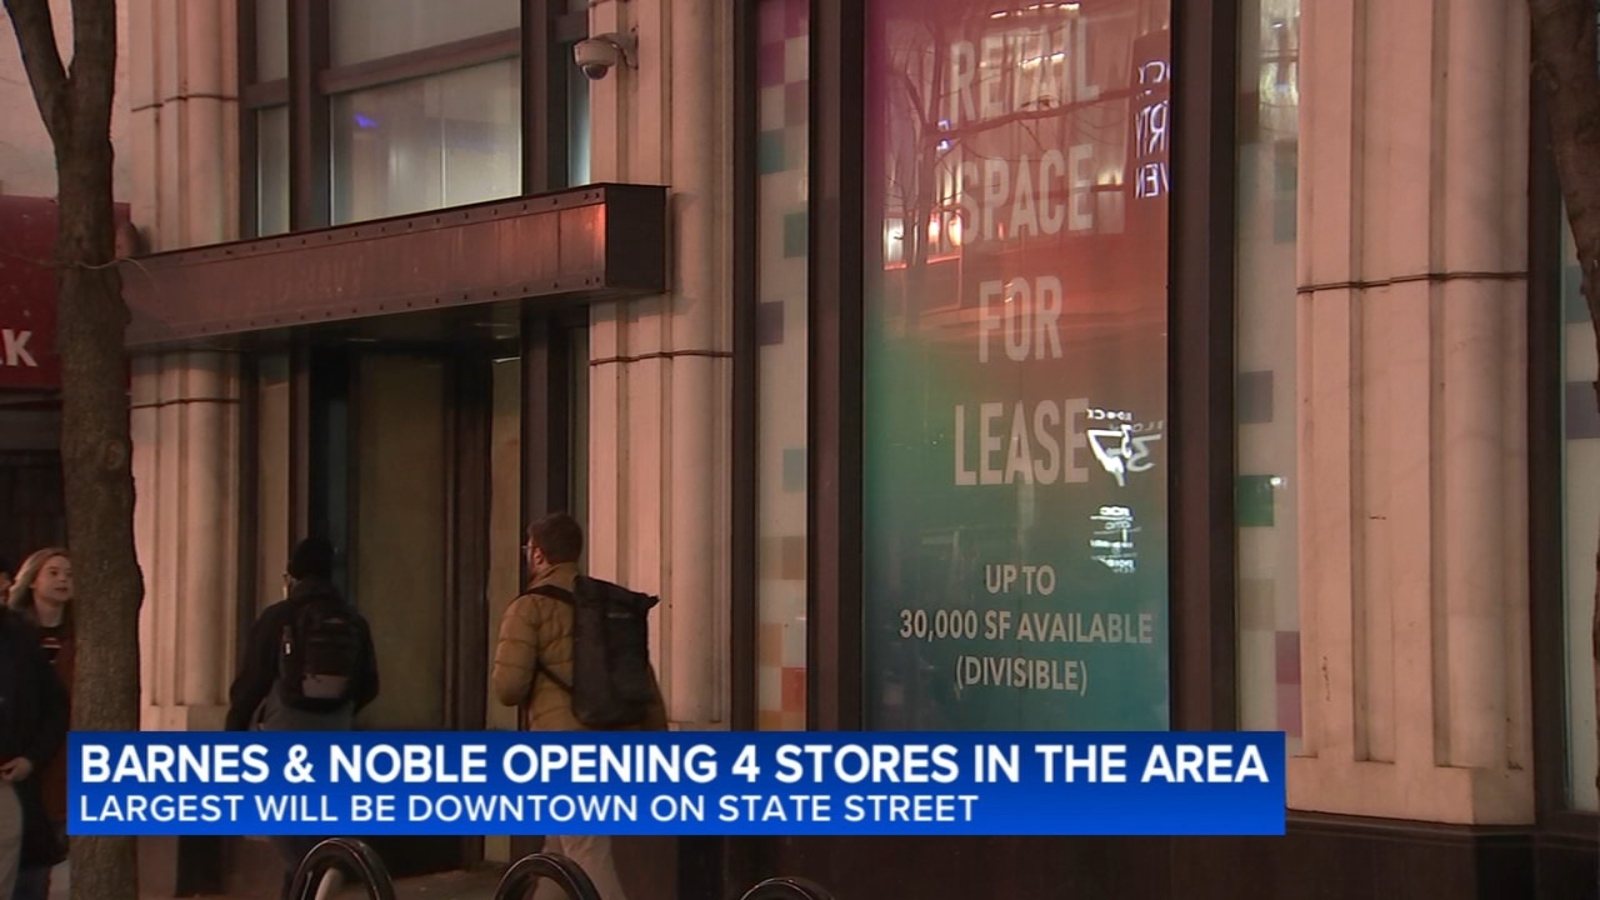
Barnes & Noble is expanding its Chicago-area footprint with four new store openings this year, including a 30,000-square-foot flagship replacing a former Old Navy at State and Randolph in the Loop expected to open this summer. Additional locations will open at 1524 E. 55th St. in Hyde Park, in a former Borders space in Oak Park, and at Westfield Old Orchard Mall in Skokie; another store opened in Naperville last spring and the chain also operates in Lincoln Park and Wicker Park. The openings indicate modest renewed demand for brick-and-mortar retail and commercial space locally but are unlikely to move national markets or materially affect investor decisions.
Market structure: Local opening of four Barnes & Noble stores (30k ft flagship in Loop plus three suburban sites) benefits mall/High-Street landlords (Simon Property Group SPG, Macerich MAC), specialty retail service providers (security, fixtures) and experiential retail demand; it directly improves micro-market foot traffic by an estimated 5–10% in nearby centers in the first 6–12 months, but unlikely to materially change national e‑commerce share. Competitive dynamics favor landlords who can offer large-format space at flexible rents; used-book and indie sellers gain incremental demand but online incumbents (AMZN) see limited margin impact given scale advantages. Supply/demand: repurposing vacant big-box (Borders/Old Navy) into bookstores signals available supply being absorbed with lower rent thresholds, implying modest upward pressure on effective mall occupancy rates (0.5–2% lift regionally). Cross-asset: small positive for commercial mortgage-backed securities (CMBS) spreads (tighten 5–15 bps if trend broadens); negligible FX/commodities impact.
Risk assessment: Tail risks include a consumer discretionary pullback (national retail sales down 3%+ q/q) or a failure of experiential retail to scale, which could leave landlords with long-term vacancy and force repricing of 7–10% in REIT valuations. Immediate (days) effects are minimal; short-term (weeks/months) may show improved foot-traffic KPIs and lease renewals; long-term (years) secular e‑commerce trends remain the dominant risk. Hidden dependencies: private equity guarantees on leases, landlord rent concessions, and localized tourism patterns can mask real profitability for 6–12 months. Catalysts: quarterly mall NOI prints, Placer.ai traffic data and announcements of further store rollouts within 30–90 days.
AI-powered research, real-time alerts, and portfolio analytics for institutional investors.
Request DemoOverall Sentiment
mildly positive
Sentiment Score
0.30
Trade implications: Tactical constructive stance on mall REITs that own urban flagship and power-center assets—establish small overweight positions (1–2% portfolio) in SPG and MAC with 6–12 month horizons; expect 8–15% upside on a sustained occupancy improvement and tighten in cap rates. Pair trade: long XRT (SPDR Retail ETF) vs short IBUY (Amplify Online Retail ETF) sized 1.5%/1.0% for 3–6 months to express brick‑and‑mortar outperformance if foot traffic trends continue; exit if XRT underperforms IBUY by 5% or if same-store sales turn negative. Options: use 3–6 month call spreads on SPG to cap premium (buy 5% OTM / sell 15% OTM) sized to 0.5% notional for asymmetric upside.
Contrarian angles: Consensus may overstate structural revival — this is hyper-local reuse of cheap large-format inventory rather than a national bookstore renaissance; markets may be underpricing single-digit occupancy re-acceleration in core malls (mispricing ~5–12%). Historic parallel: post-2009 retail re-leasing often produced short-lived spikes in foot traffic but required continual tenant mix upgrades; unintended consequences include higher CapEx for landlords and rent-by-performance leases that reduce near-term cash flow. Actionable miss: small positive surprises in quarterly mall NOI or Placer.ai traffic could move beaten-down mall REITs 10%+ quickly; conversely, failure to convert store openings into stable sales would trigger a faster repricing down of 8–12%.
