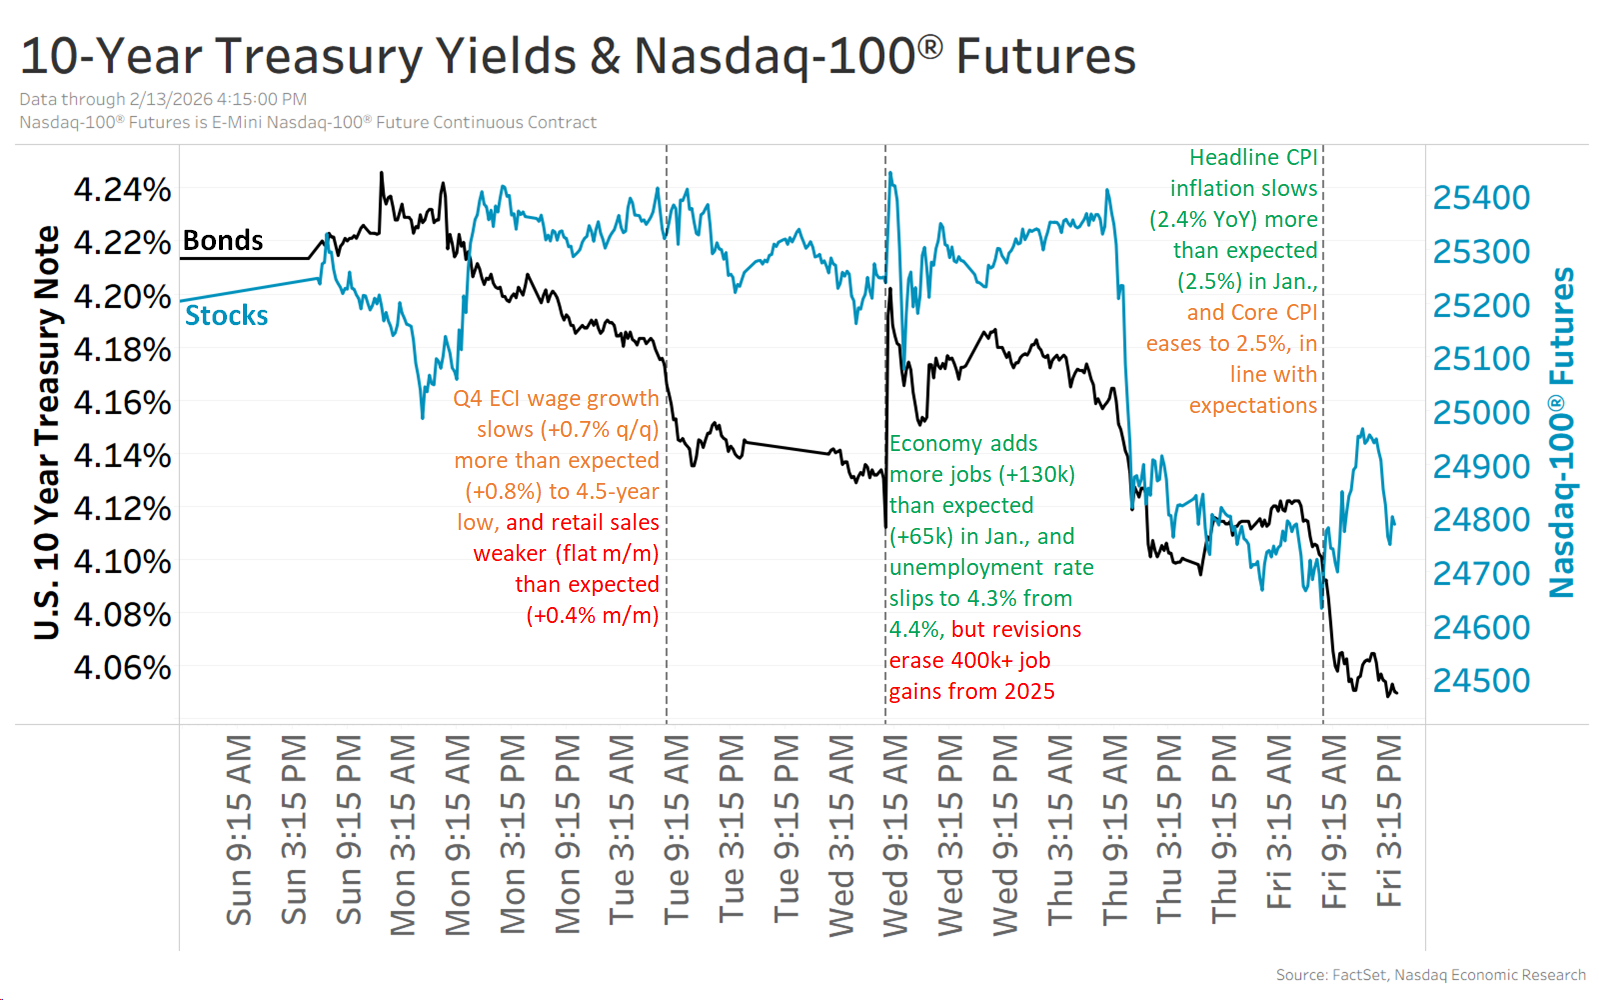
Annual payroll revisions removed over 400,000 jobs, leaving just 181,000 net hires for the year, though January data were stronger with 130,000 jobs added (double expectations) and the unemployment rate dipping to 4.3%; private payrolls rose 172,000 in January. CPI cooled as headline inflation fell to 2.4% YoY and core to 2.5%, lifting market bets to roughly 65bp of Fed cuts this year; markets were mixed — an AI-related selloff left the Nasdaq-100 down ~1% for the week while 10-year Treasury yields fell about 15bp to ~4.05%.
Market structure: Cooler CPI (headline 2.4%, core 2.5%) + January payroll upside (+130k) but large -400k revision shift the narrative toward a “soft-landing” trade that prices ~65bp of cuts. Winners are long-duration assets and growth/AI names (QQQ, NVDA, MSFT) and real-assets that re-rate on lower yields; losers are rate-dependent financials and regional banks (XLF, KRE) if cuts materialize. Cross-asset: 10yr at ~4.05% supports TLT/VNQ/XLU strength, risks USD weakness and commodity support if cuts accelerate.
Risk assessment: Tail risks include inflation re-acceleration (services inflation stickiness) that sends 10yr >4.5% and punctures growth multiple, or a labor shock that flips Fed hawkishness; probability medium but impact high. Immediate (days): volatility around next CPI/PCE & payroll prints; short-term (weeks–months): market repricing of cut probability; long-term (quarters): earnings leverage for AI/mega-caps if lower rates persist. Hidden dependency: market assumes Fed credibility to cut—data divergence or Fed jawboning can quickly reverse flows.
Trade implications: Favor relative-value exposure to duration-sensitive growth and interest-rate convexity: buy long-duration ETFs and selective AI leaders while hedging financials. Options: use 60–120 day call spreads on QQQ/NVDA to express a rate-fall rally and put spreads on KRE/XLF to protect vs NIM compression. Monitor 10yr thresholds (4.25% resistance, 3.85% confirmation) as execution/stop triggers.
Contrarian angles: Consensus leans toward easing; miss is services inflation persistence or stronger-than-expected payrolls that keep rates higher — this would make long-duration names overstretched. AI selloff could be an entry for NVDA/MSFT if yields stay ≤4.10%, but if 10yr spikes above 4.4% treat any long-duration position as crowded and trim. Historical parallel: 2019 rate-cut rallies faded when data surprised; manage convexity risk accordingly.
AI-powered research, real-time alerts, and portfolio analytics for institutional investors.
Request DemoOverall Sentiment
mixed
Sentiment Score
0.05
