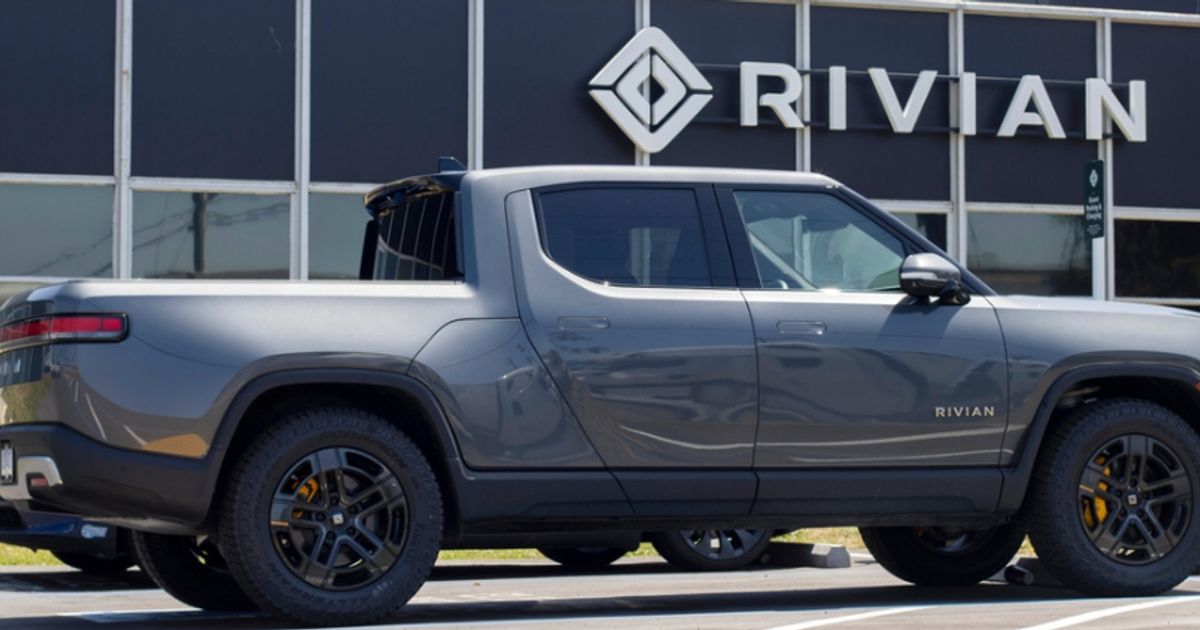
Rivian reported Q4 2025 production of 10,974 vehicles and deliveries of 9,745, a roughly 31% decline from Q4 2024 (≈14,183), while full-year 2025 production totaled 42,284 with deliveries of 42,247 versus 49,476 produced and 51,579 delivered in 2024 (≈18% annual delivery decline). The results were in line with Rivian's own expectations but came modestly below Wall Street forecasts (Q4 consensus ~10,050; full year ~42,500); the company will release detailed Q4 and FY2025 financials after markets close on Feb. 12. Investors should note the material year‑over‑year delivery drop, the alignment with company guidance, and the slight miss to analyst estimates when assessing near-term operational momentum and stock implications.
Market structure: Rivian’s 31% Q4 and ~18% full-year delivery declines (9,745 Q4; 42,247 FY) tighten its competitive position vs scale incumbents (TSLA, GM, F) that can protect margin via volume/price. Direct winners: larger OEMs and battery/charging networks capturing marginal buyers; losers: Rivian suppliers, small-cap EV peers with similar cost structures. Production ≈ deliveries implies the company is not building inventory, signaling demand softening rather than channel glut, and expect RIVN equity and credit spreads to underperform while options IV rises around Feb 12 earnings.
Risk assessment: Short-term (days–weeks) tail risks include a surprise guidance cut on Feb 12, factory stoppage, or accelerated price cuts causing >20% downside; medium-term (3–12 months) risks are cash burn and refinancing needs if margins compress and deliveries stay down ~15–25%. Hidden dependencies: heavy fixed-cost leverage at Normal plant and any concentrated fleet or Amazon-linked orders could magnify volatility. Key catalysts: Feb 12 results, any announced price promotions by competitors within 60 days, and macro consumption prints (next 1–3 months).
Trade implications: Direct play — establish a tactical 2–4% portfolio short in RIVN ahead of Feb 12 or buy puts to hedge; target 15–30% downside on a weak guide, stop at +10%. Pair trade — short RIVN vs long TSLA (dollar-neutral) sized for 3–6 months to exploit scale differential; options — buy 3-month RIVN puts ~10–20% OTM (Mar expiry) or a Feb earnings vertical to limit premium. Rotate 2–6% from small EV names into cyclical auto names (F/GM) and parts suppliers for 6–12 months.
Contrarian angles: Consensus focuses on absolute delivery misses; it underweights management's matched production/delivery cadence which reduces inventory risk — a narrow miss vs Street may be priced in, leaving limited downside unless guidance collapses. Reaction is likely underdone for credit and options IV but could be overdone for equity if Feb results merely reiterate guidance; historical parallel — post-ramp production volatility (Tesla 2018–20) preceded pricing and model refresh recovery. Unintended consequence: aggressive shorting could force management to accelerate discounts and buybacks, creating a tactical recovery opportunity — size positions conservatively (small, hedged).
AI-powered research, real-time alerts, and portfolio analytics for institutional investors.
Request DemoOverall Sentiment
mildly negative
Sentiment Score
-0.30
Ticker Sentiment
