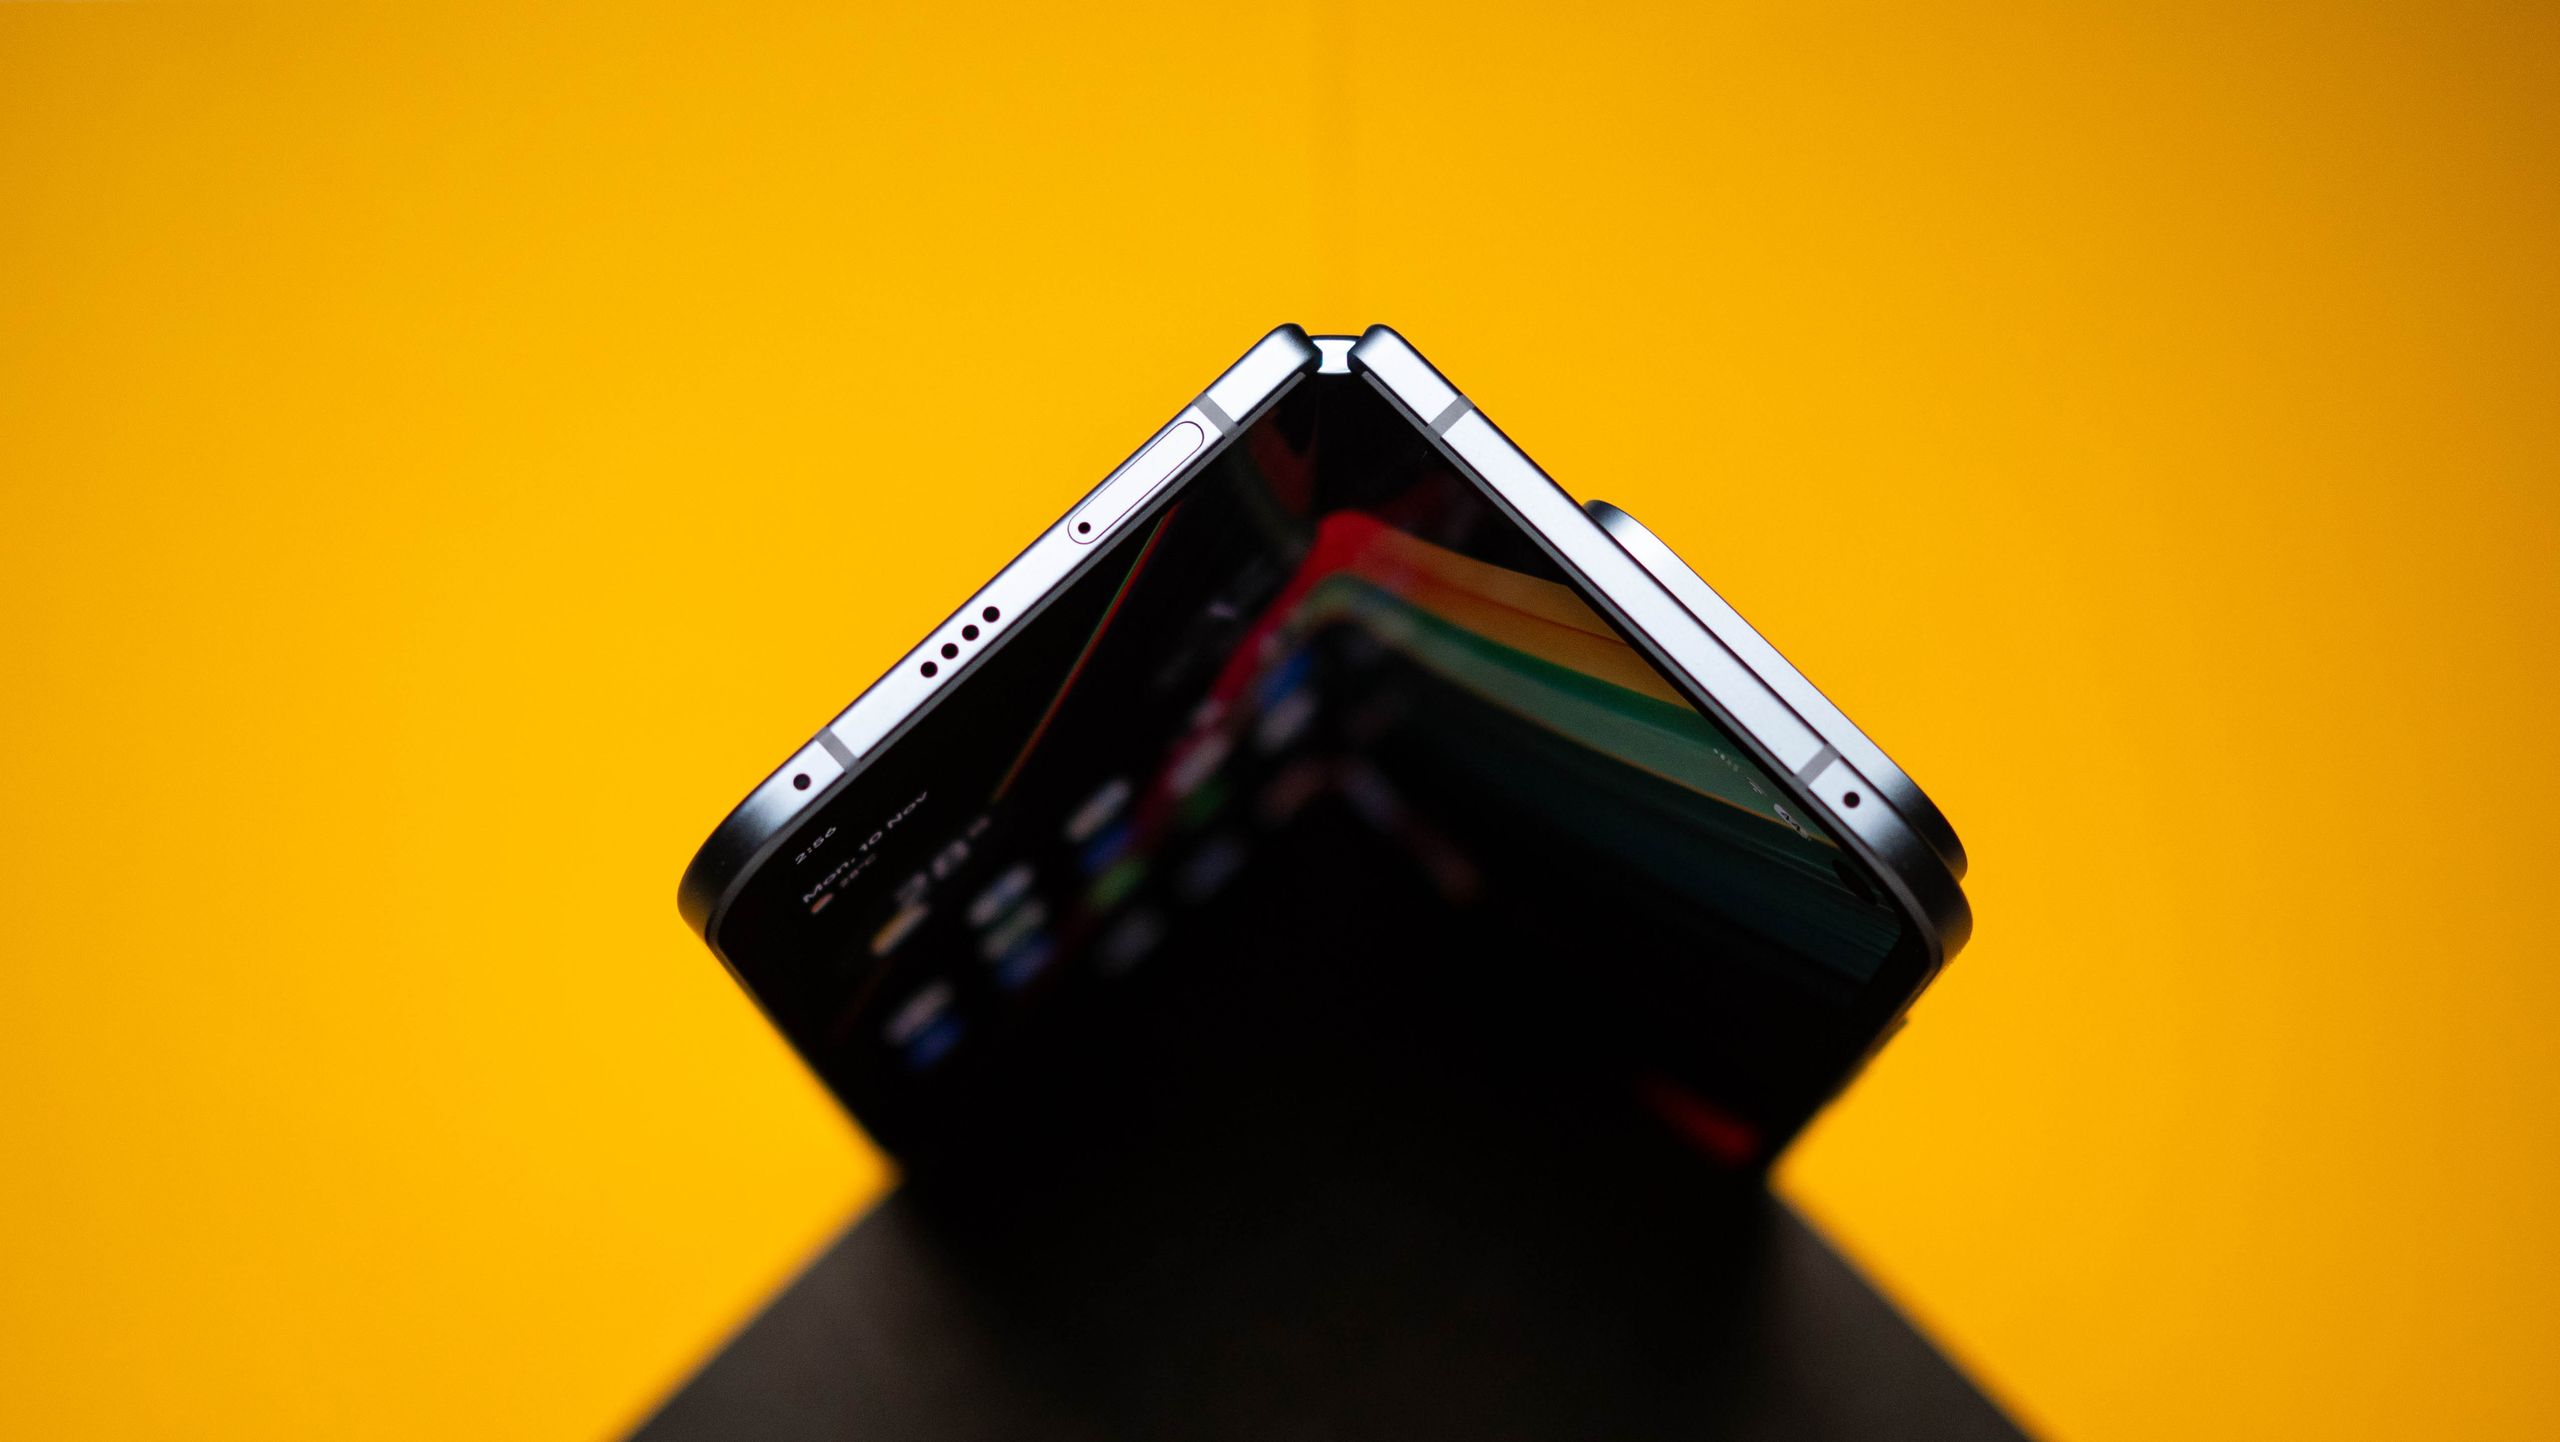
IDC expects a meaningful resurgence in the foldable smartphone category driven by thinner, more durable designs, the arrival of trifolds and a projected Apple entry in 2026 that IDC forecasts will capture ~22% unit share and ~34% value share in its first year. After a modest 10% YoY growth in 2025 and historical unit share never topping 1.6%, IDC now projects total foldable market growth of ~30% in 2026; early trifolds (Huawei’s Mate XT/Mate XTs) sold ~740,000 units and generated ~$2.0B at ~$2,500 ASP, while Samsung’s Galaxy Z TriFold reportedly sold out at launch, signaling stronger consumer demand and potential upside for suppliers and OEMs exposed to the segment.
Market structure: Apple entering foldables in 2026 (IDC: ~22% unit / 34% value share first year) is a demand accelerator that shifts pricing power to premium OEMs and supply-chain specialists (flexible OLED, hinge, thin-film). Winners: AAPL, tier-1 display makers, hinge/polymer suppliers, Qualcomm/TSMC and AI infrastructure vendors; losers: low-margin incumbents and any OEMs unable to source displays. Expect 2026 foldable unit growth near IDC’s 30% forecast, creating tight near-term supply for flexible panels concentrated among a few suppliers.
Risk assessment: Tail risks include an Apple delay (push beyond H1–H2 2026), large-scale reliability recalls, or sudden antitrust restrictions on bundling (6–18 month impact); supply shocks (OLED capacity) could raise component costs 10–30% vs. baseline in 2026. Hidden dependencies: hinge patents, app ecosystem maturation, and carrier promotion incentives; key catalysts are Apple launch timing, Samsung tri-fold sell-through, and seasonal preorder data (next 3–6 months).
Trade implications: Direct plays: favor AAPL (premium capture) and QCOM/TSMC (component demand), plus NVDA exposure for AI-driven use-cases that expand foldable utility. Use LEAPs on AAPL (Jan‑2027 10–20% OTM) and QCOM call spreads to size convex exposure; consider pair trades to express relative winners vs. ad-revenue-exposed names over a 6–12 month horizon. Rotate portfolio overweight into semis and display suppliers, underweight ad-heavy internet names if Apple’s share tracks above 20% post-launch.
Contrarian angles: Consensus underestimates Android’s ability to compete on price — trifolds and thinner designs may keep Android share stable even as Apple grows value share, so Android supply-chain equities could be underpriced. Conversely, the market may be overpricing upside if Apple’s first-year penetration lags forecasts or if app/OS experience is weak; historical parallels include early smartwatch hype where Apple expanded category but vendors without ecosystem traction lost share. Unintended consequence: rapid capex to expand flexible-display supply could create oversupply by 2028, pressuring component prices and OEM margins.
AI-powered research, real-time alerts, and portfolio analytics for institutional investors.
Request DemoOverall Sentiment
moderately positive
Sentiment Score
0.45
Ticker Sentiment
