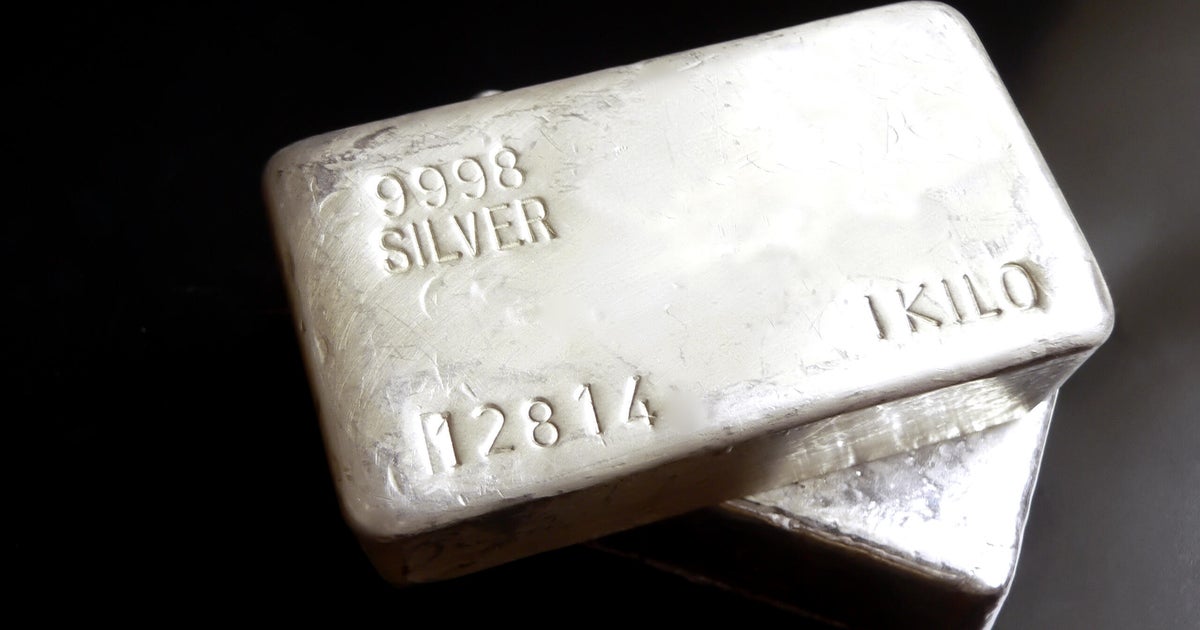
Silver is trading at $75.85/oz as of December 26, 2025 — up from roughly $29.38 a year ago — implying a raw metal value of about $7,500 for a 100‑ounce bar. Typical dealer buyback rates run 95–99% of spot, suggesting sale proceeds between approximately $7,125 and $7,425; upside has been driven by geopolitical tensions, Fed rate cuts, currency concerns and strong industrial demand, while volatility and timing remain material risks. Managers should weigh the substantial recent gains against silver's historical volatility and potential further Fed moves or shifts in industrial demand when deciding whether to realize gains or hold exposure.
Market structure: The current >150% Y/Y silver move (spot ~$75.85) makes clear winners—silver ETFs (SLV, SIVR), primary silver miners (PAAS, AG, HL) and solar component suppliers—while silver consumers (jewelry, some electronics) face margin pressure. Pricing power will favor low-cost producers and branded refiners; generic scrap and recycling become more economic above ~$60–70/oz, capping long-term upside. Cross-asset: stronger silver correlates with weaker USD and rising inflation breakevens; expect upward pressure on gold, compression of real yields and higher implied volatility across commodity options.
Risk assessment: Tail risks include a rapid Fed U-turn (re-hike) or disinflation shock that could cut silver >40% in weeks, or large ETF liquidations; conversely, accelerated solar build could lift spot into $90–$120 in 6–18 months. Immediate (days) risk = intraday swings of several dollars/oz; short-term (weeks/months) driven by Fed communication and DXY moves (watch DXY 95/100 thresholds); long-term (quarters/years) depends on mine capex lead times and recycling elasticity. Hidden dependency: industrial demand (PV silver loadings) — a small % change in grams per panel materially alters demand vs supply.
Trade implications: Direct tactical plays—establish a 1–2% portfolio long in SLV scaled over 2–4 weeks with a stop-loss if spot sustains < $55 (~-27%) and a take-profit band at +30% (spot ~$98) or on spot > $100. Add 1–2% selective exposure to PAAS/AG for leverage to metal (use 20% trailing stop). Options: buy 3‑month SLV 25‑delta calls (small size 0.5% notional) to capture upside; alternatively sell 45‑60d OTM call spreads to monetize high IV if expecting mean reversion.
Contrarian angles: Consensus underweights substitution and recycling once silver stays >$80–90 — that process can blunt sustained rallies (2011 precedent: violent blow-off and >60% drawdown). The market may be overpricing monetary premium vs industrial fundamental; if solar manufacturers reduce silver loading or switch technologies, upside could be structurally muted. Key unintended consequence: prolonged high silver incentivizes supply response with ~12–36 month lag, so medium-term returns likely asymmetric and path-dependent.
AI-powered research, real-time alerts, and portfolio analytics for institutional investors.
Request DemoOverall Sentiment
moderately positive
Sentiment Score
0.40
