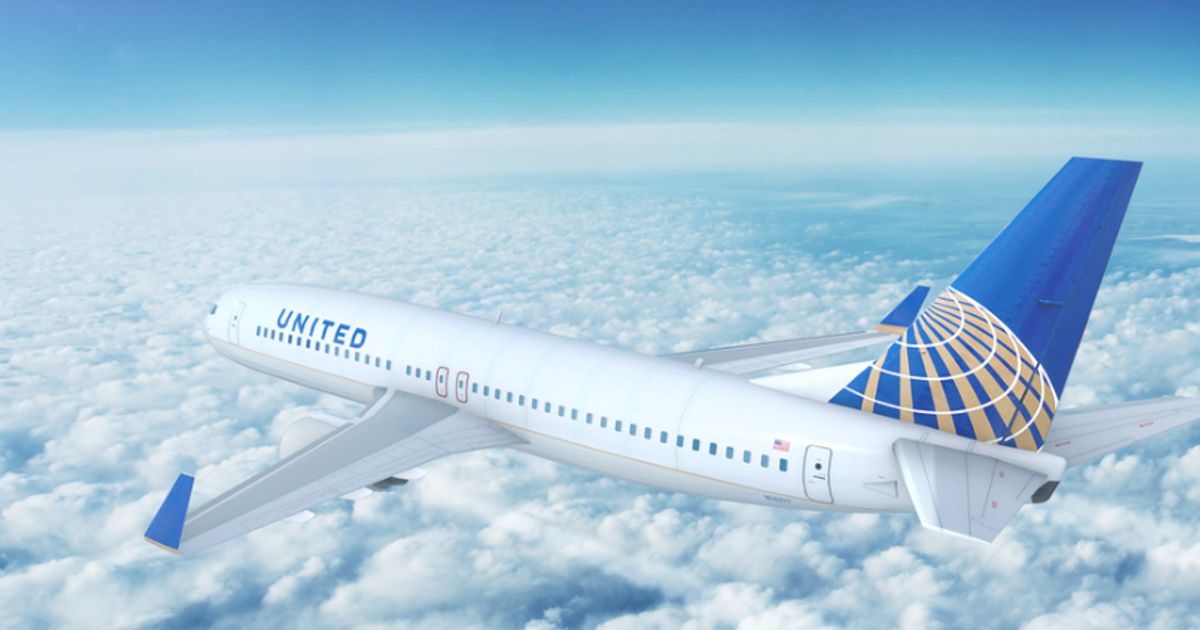
United reported a record quarter with Q4 operating revenue of $15.4 billion and adjusted EPS of $3.10 (vs. analyst estimates of $15.37B and $2.96), full-year adjusted EPS of $10.62 on $59 billion revenue, and net income of $1 billion; premium, loyalty and basic-economy revenues rose 9%, 10% and 7% respectively. Operational metrics showed ASM +6.5% to 83.37 billion and passenger miles 68.25 billion, while RASM fell 1.6% and CASM ex-items fell 0.3%; United noted a ~$250 million government-shutdown headwind and ongoing 787 delivery delays. Management provided a strong 2026 outlook, guiding adjusted EPS of $12–$14, planning to add over 100 narrowbodies and ~20 Boeing 787s, targeting capex below $8 billion and free cash flow roughly in line with last year (~$2.7B).
Winners & losers: United (UAL) is a clear near-term winner — record Q4 revenue, loyalty +10% and premium +9% show mix-driven margin upside even as RASM fell 1.6% and capacity rose 6.5% YoY. Boeing (BA) is a direct loser from ongoing 787 delivery delays that constrain United’s widebody growth cadence and create operational risk; narrowbody OEM order flow benefits Airbus and engine suppliers. Cross-asset: stronger airline cashflows and $12–$14 2026 EPS guide should tighten UAL credit spreads and support equity, while higher passenger volumes increase jet-fuel sensitivity (oil) and USD travel flows; expect modest downward pressure on market-implied airline equity vols as guidance reduces binary risk.
Risk assessment: Tail risks include a >$50/barrel+ sudden oil spike, renewed macro slowdown cutting leisure/business demand by >10% YoY, or a prolonged Boeing 787 delivery slippage costing $0.5–$1.0bn of EBIT in 2026. Immediate (days) risk is sentiment reversal around any 787 update or union headlines; short-term (3–6 months) risk is unit revenue compression if capacity growth outpaces demand; long-term (2–4 years) risk is margin pressure from fleet expansion if yield mix normalizes. Hidden dependency: loyalty revenue is concentrated in co-branded card economics — a recession or card churn could knock 5–10% off loyalty revenue.
Trade implications: Tactical long UAL equity exposure is warranted to play upgraded guide — consider establishing a 2–3% portfolio long in UAL within 1–4 weeks, target +15% in 3–9 months, stop-loss -12%. Relative trade: long UAL vs short AAL (American Airlines) or LUV (Southwest) — United’s premium/loyalty momentum suggests 200–400bp share gain in high-yield routes over 6–12 months. Options: buy a 3–6 month UAL call spread (e.g., 1x long 6-month ATM+10% calls funded by selling ATM+30% calls) to cap cost and capture continued EPS re-rating. Sector: overweight Travel & Leisure equities, underweight Aerospace suppliers/BA exposure until 787 cadence clears (monitor next 90 days).
AI-powered research, real-time alerts, and portfolio analytics for institutional investors.
Request DemoOverall Sentiment
moderately positive
Sentiment Score
0.60
Ticker Sentiment
