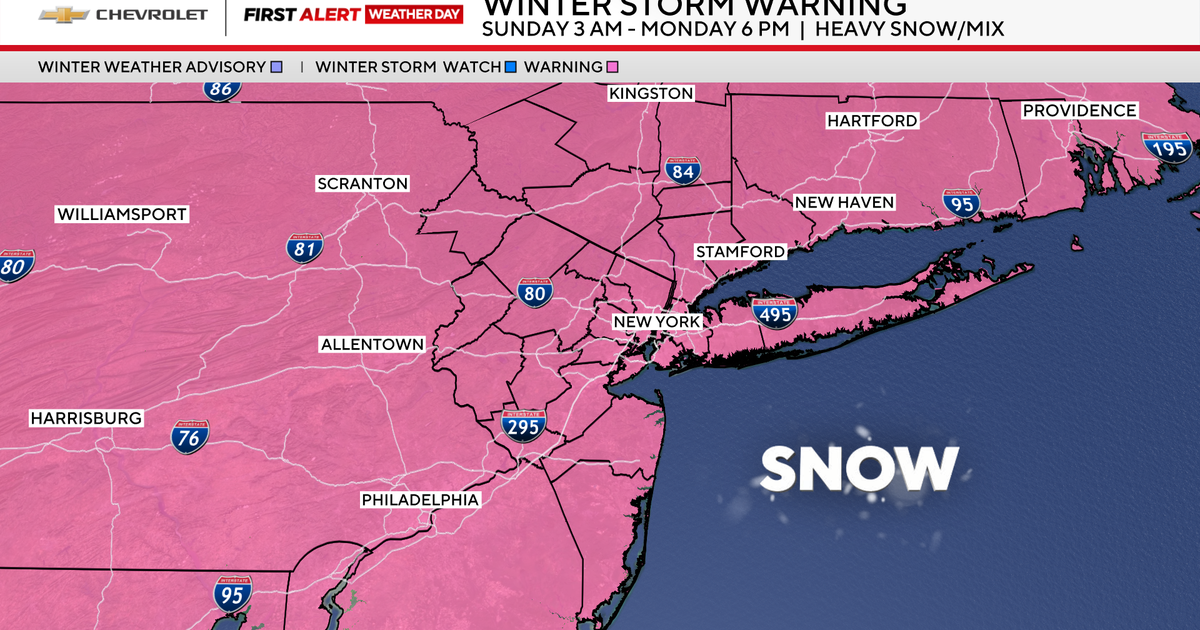
A potent winter storm will hit the NYC metro area beginning early Sunday, with the heaviest snow between about 7 a.m. and 2 p.m. when rates could reach 1–2 inches per hour; totals are forecast at 8–12 inches for New York City (12+ inches north/west), 8–12 inches on much of Long Island's North Shore and parts of central Jersey, and up to 18–22 inches in far northwestern New Jersey/upper Hudson Valley. Governors have declared states of emergency and New York activated the National Guard; the storm will transition to a freezing rain/sleet mix for coastal/southern areas Sunday afternoon (ice accretion up to ~0.25 inches) before changing back to snow overnight, raising risks of travel disruption, downed trees/branches and localized coastal flooding. The event is regionally significant for logistics, transport and infrastructure operations but is unlikely to move broader financial markets materially.
Market structure: Near-term winners are suppliers of de-icing, heating fuel and storm-restoration services (road-salt maker Compass Minerals (CMP), heating oil/distillate suppliers, local utility contractors) and big-box retailers (HD, LOW) that sell snow-removal gear; losers are travel/logistics (JBLU, LUV, DAL, FDX, UPS) and coastal leisure businesses. Pricing power is concentrated in scarce, regional physical goods (salt, diesel, short-term labor) where supply is inelastic over days–weeks, implying 10–30% spot price moves possible for specialty inputs. Cross-asset: expect prompt natural gas/heating oil futures to spike for 1–3 weeks, airline/logistics equity vols to jump near-term, and short-term municipal liquidity/tax anticipation notes to tighten modestly.
Risk assessment: Tail risks include multi-day power outages from ice/wind causing outsized insured losses or fuel shortages that cascade into supply-chain stoppages; probability <10% but severity high for regional insurers/utilities. Time horizons: immediate (0–7 days) travel/logistics disruption and commodity demand; short (2–8 weeks) insurance claims, contractor revenue recognition and spot-price mean reversion; medium (3–12 months) modest capex and municipal budget reprioritization. Hidden dependencies: tree damage driving extended localized outages, trucking labor constraints delaying replenishment, and municipal procurement lags for salt and contractors.
Trade implications: Direct plays: short-dated directional/volatility trades — buy prompt NG/distillate call spreads (2–4 week expiries), establish small long positions in CMP and HD for 1–6 week tactical gains, and use put or put-spread exposure on NYC-centric carriers (JBLU) and regional logistics (FDX) for operational risk. Pair trades: long HD (retail spike) vs short FDX (delivery disruption) for 2–6 week horizon. Options: prefer defined-risk spreads (verticals) and calendar spreads to capture near-term IV and limit tail loss.
Contrarian angles: Consensus focuses on travel pain; the market underestimates price elasticity of specialty inputs and contractor services — CMP and niche restoration contractors can out-earn expectations for 2–8 weeks. Overreaction risk: airline equities may already price most disruption; use spreads not outright shorts. Historical parallel: Feb 2021 NYC storm produced single-week jumps in CMP/HD and a transient NG impulse; if warming aloft reduces totals, these trades mean-revert quickly — cap position sizes and set 7–20% stop/profit thresholds.
AI-powered research, real-time alerts, and portfolio analytics for institutional investors.
Request DemoOverall Sentiment
mildly negative
Sentiment Score
-0.30
