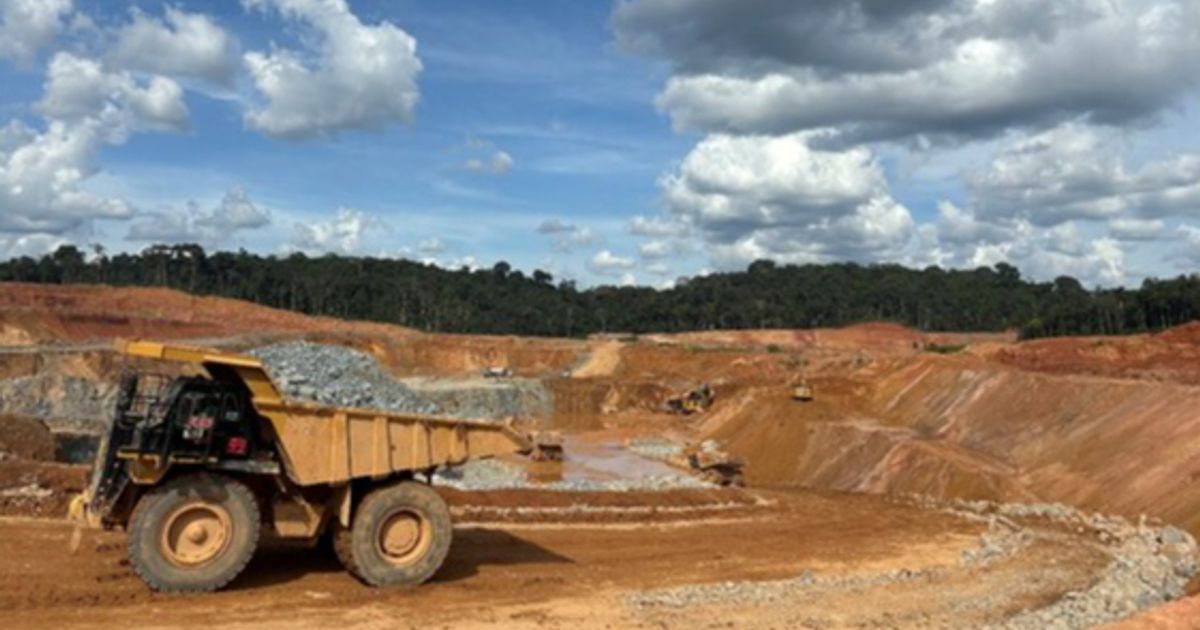
G Mining reported stronger operating metrics at its Tocantinzinho gold mine in Q4 2025 with production of 47,346 oz, mill throughput of 1.077 million tonnes at 1.49 g/t and recoveries of 91.8%; average mining rate rose to 64.7 ktpd (up 18% QoQ) after commissioning additional equipment. Full-year production was 171,871 oz from 4.086 million tonnes at 1.44 g/t with 90.6% recoveries, and gold sales of 47,457 oz in Q4 (172,093 oz FY), while safety recorded two lost-time incidents (LTIFR 0.15). The update signals improved operational productivity in the mine’s first full year of commercial production, which should support near-term cash generation and operational confidence for stakeholders.
Market structure: G Mining's Q4 throughput (1.077 Mt, 47,346 oz) and full-year 171,871 oz (~5.35 t) lift the company into steady producer status but represent ~0.15% of annual global supply, so macro gold price impact is negligible. Direct winners are GMIN.TO shareholders, miners with similar low-cost, scalable Brazilian operations (potential M&A suitors), and equipment vendors; losers are high-cost juniors and toll-treatment providers facing lower feed. Cross-asset effects are idiosyncratic: modest positive equity re-rate risk for GMIN, limited impact on bullion, small credit spread tightening for GMIN debt; FX sensitivity remains material given BRL exposure to operating costs.
Risk assessment: Key tail risks are regulatory/environmental actions in Brazil (suspension risk within 30–180 days), a >10% grade decline or recovery drop below ~88% that would meaningfully compress free cash flow, and a sharp gold price fall under $1,700/oz that stresses junior balance sheets. Near-term (days–weeks) volatility will follow quarterly release cadence and any operational guidance; medium-term (3–12 months) hinge on grade continuity and equipment uptime; long-term (12–36 months) depends on reserve conversion and strip ratio trends. Hidden dependencies include contractor performance, fuel/logistics in Amazon, and FX-denominated E&S capex that can swing unit costs by double digits.
Trade implications: Tactical long GMIN.TO exposure captures operational optionality — target 2–3% portfolio position with a 9–12 month horizon and 30–40% upside target if production growth and recoveries hold. Use a defined-risk options approach: buy 6–9 month call spreads 25–40% OTM to limit premium; alternatively sell put spreads 15–20% below current levels to accumulate, size to permit 15–20% max drawdown. Consider a relative-value pair: long GMIN.TO vs short GDXJ (equal dollar) for 6–9 months to isolate company-level execution vs broader junior beta.
Contrarian angles: Consensus may underweight grade depletion risk — commissioning boosts often front-load recoveries, with normalization over 12–24 months common in greenfield mines, so upside could be overdone if grades slip 10%+. Conversely, investors under-appreciate operational leverage: a sustained +18% q/q mining rate with >90% recoveries can expand free cash flow materially if gold > $1,850. Watch for unintended consequences: faster mining increases sustaining capex and equipment replacement needs, which can flip cash flow profiles in year two if not capitalized correctly.
AI-powered research, real-time alerts, and portfolio analytics for institutional investors.
Request DemoOverall Sentiment
moderately positive
Sentiment Score
0.35
Ticker Sentiment
