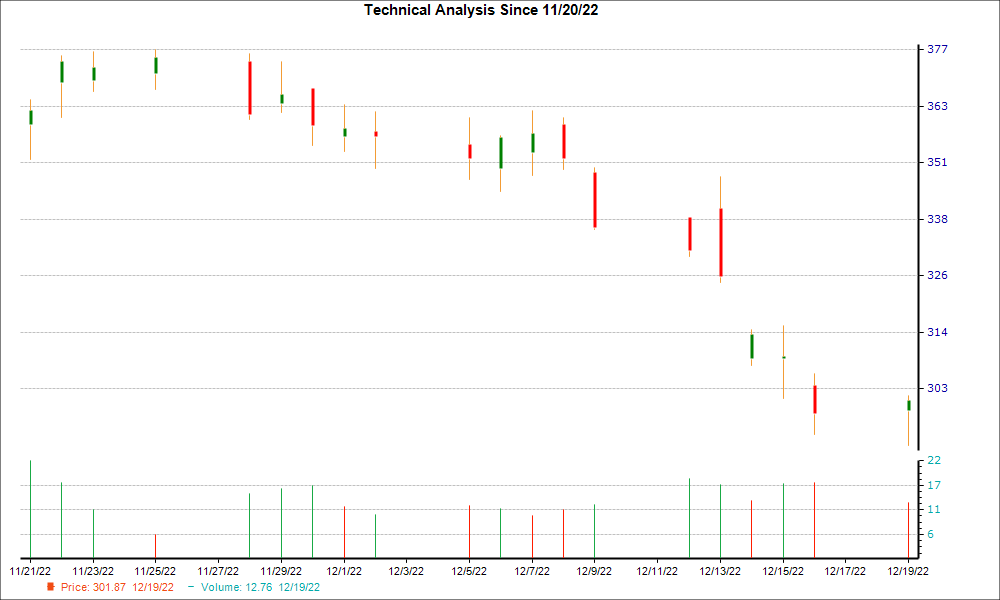
Dillard's (DDS) stock, which recently experienced a 6.1% decline, formed a 'hammer chart pattern' in its latest trading session, signaling potential technical support and a nearing bottom. This technical indication is significantly bolstered by fundamental factors, including a 2.1% increase in consensus EPS estimates for the current year over the past 30 days and a Zacks Rank #1 (Strong Buy), collectively suggesting a high probability of a trend reversal and potential outperformance for the department store operator.
Dillard's (DDS) stock presents a compelling case for a potential trend reversal, where recent technical signals are strongly supported by positive fundamental indicators. Following a 6.1% decline over the past week, the formation of a "hammer chart pattern" suggests selling pressure may be exhausting and a support level could be forming. This technical pattern is significantly reinforced by improving analyst sentiment, as the consensus EPS estimate for the current year has increased by 2.1% over the last 30 days, indicating that analysts anticipate better earnings than previously forecast. This fundamental strength is further underscored by the stock's Zacks Rank #1 (Strong Buy), which is based on positive trends in earnings estimate revisions and places DDS in the top 5% of ranked stocks. The convergence of a bullish technical formation with quantifiable positive fundamental revisions points to a potential turnaround and a higher probability of near-term outperformance.
AI-powered research, real-time alerts, and portfolio analytics for institutional investors.
Request DemoOverall Sentiment
strongly positive
Sentiment Score
0.80
Ticker Sentiment
