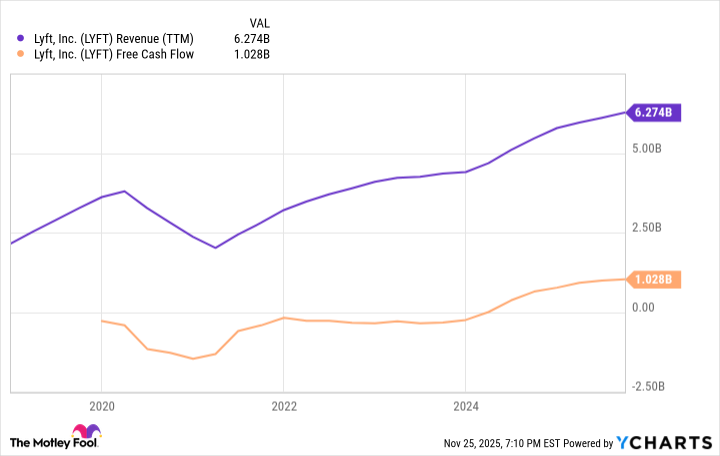
Lyft went public at $72 in early 2019 and the stock is down about 73% since then (a $1,000 investment would be worth roughly $272), but the company has posted consistent double-digit revenue growth since 2021 (11% YoY in Q3 2025) and turned positive on trailing-12-month free cash flow in 2024. The shares trade at a cheap multiple—about 8x free cash flow—and management has repurchased $400 million of stock in the first three quarters of 2025, yet significant competitive risks remain from larger rivals like Uber and potential autonomous-vehicle disruption. Continued profitable growth and capital returns are key to any upside case, while investor skepticism appears to be keeping the valuation subdued.
Market structure: Lyft is a quasi-duopoly participant in U.S. urban mobility where winners are platform shareholders and existing drivers (higher utilization), losers are legacy taxi operators and low-scale local competitors. Lyft’s 11% YoY revenue growth (Q3 2025) plus positive trailing-12-month FCF since 2024 and $400m buybacks YTD materially strengthen shareholder return power even if market share remains flat vs. UBER. Supply/demand remains driver-constrained in urban cores (supporting price power), while AV adoption is a multi-year tail risk; equity volatility for LYFT is likely to stay elevated until next 2–4 quarters of cadence, with minimal FX/commodity exposure but potential corporate credit spread widening if macro tightens.
Risk assessment: Key tail risks are regulatory (driver reclassification or minimum-wage mandates) within 3–12 months, rapid AV commercialization (3–7+ years), and recession-driven mobility contraction (>10% ridership decline in a downturn). Hidden dependencies include the sustainability of buybacks (cash vs. operating needs) and driver incentive pass-throughs that can compress FCF if competitive bidding resumes; catalysts to watch: quarterly FCF growth >20% YoY, incremental buyback announcements (> $600m annualized), and any favorable/unfavorable state-level gig rulings within 90 days.
Trade implications: Valuation at ~8x FCF implies a re-rate target of 12–14x would imply ~50–75% upside if FCF growth persists; establish a 2–3% long LYFT position on a 12-month horizon, scaling up on >20% positive FCF revisions. Consider a dollar-neutral pair (long LYFT 2% / short UBER 1.5%) to express buyback/FCF re-rating vs. Uber’s broader but pricier franchise, and use options: sell 3-month cash-secured puts ~10% OTM or buy a 12-month call spread to cap cost and target 50%+ upside.
Contrarian angles: Consensus underweights durable buyback-driven EPS accretion and is overfocused on long-term AV disruption — if Lyft sustains FCF and repurchases >$1bn/year, low multiple should compress and force quick re-rating. Reaction may be underdone on the upside (cheap valuation) but overdone if a regulatory shock forces labor-cost reclassification; historical parallel: value re-ratings after sustained FCF turn (e.g., post-2019 asset-light turnarounds) suggest patience for 6–18 months is required.
AI-powered research, real-time alerts, and portfolio analytics for institutional investors.
Request DemoOverall Sentiment
mildly positive
Sentiment Score
0.21
Ticker Sentiment
