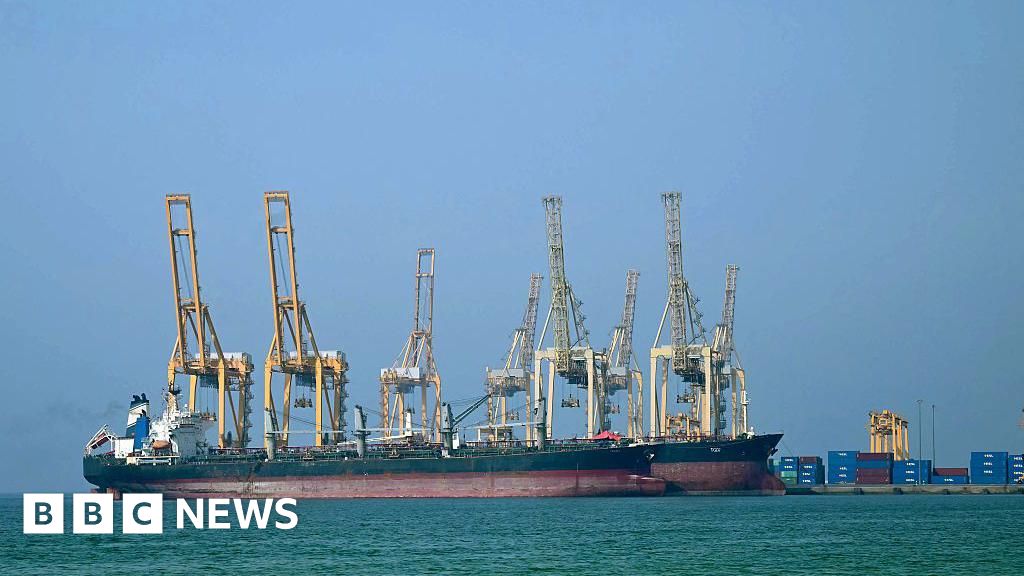
President Trump announced the United States will provide political-risk insurance through the U.S. Development Finance Corporation and offer U.S. naval escorts 'if necessary' to protect shipping through the Strait of Hormuz after Iranian threats and reported attacks have nearly halted traffic; roughly 20% of global oil and gas transits the strait and Lloyds List Intelligence reports about 200 crude and product tankers stranded. The measures briefly eased oil price moves, but insurers have already raised premiums and analysts warn that insurance and escorts may not remove safety concerns; a prolonged disruption could push crude above $100/barrel and add upward pressure to petrol prices and inflation globally.
Market structure: Winners are upstream oil producers (XOM, CVX, EOG) and midstream/tanker owners (FRO, EURN) as transit disruption in the Strait of Hormuz tightens seaborne crude supply and pushes spot freight rates higher; losers include airlines/cruise operators (AAL, UAL, RCL, JETS ETF) and import-dependent refiners in tight-margin geographies. Competitive dynamics favor firms with owned storage/tankers and integrated producers—pricing power rises for suppliers who can divert barrels; insurance and rerouting raise per-barrel transport costs by an estimated 5–15% near-term. Cross-asset: oil price shock tends to send USD and nominal U.S. yields up (sell Treasuries), lift gold and TIPS, and blow out energy implied vol (WTI/Brent options implied vol +30–60%), while EMFX and corporate credits in energy-importing nations weaken.
Risk assessment: Tail risks include a full closure of Hormuz (low-probability, high-impact) that could push Brent >$120–150/bbl and prompt strategic reserve releases, or a naval incident expanding the war risk to global insurance markets. Time horizons: immediate (days) = volatility and premium in freight/war-risk insurance; short-term (weeks–months) = rerouting costs, SPR releases and OPEC+ response; long-term (quarters+) = capex repricing and structural trade-route shifts. Hidden dependencies: U.S. SPR size, Chinese buying demand, and spare OPEC+ export capacity govern how prolonged price spikes become; catalysts include any credible U.S. naval escort operation, large-scale Iranian interdiction, or coordinated SPR release.
Trade implications: Establish 2–3% long positions in XOM and CVX (high free cash flow, dividend cushions) and 1–1.5% long in tanker names FRO or EURN to capture higher VLCC rates; pair with 1–2% short exposure to airlines (AAL) or JETS ETF to hedge demand destruction from higher jet fuel. Use options: buy 3-month Brent call spreads (e.g., strike = spot / spot+10) sized to 1–2% notional to cap downside; buy 3–6 month TIPS (TIP) or 2% allocation to short-duration Treasury exposure (sell 2–3% of TLT) if U.S. CPI re-accelerates. Entry now while front-month oil vols are elevated; take profits if Brent > $100 within 30 days or cut positions if Brent reverts below $75 for 14 calendar days.
Contrarian angles: The market may be overpricing structurally permanent supply loss—histor parallels (2019 Houthi disruptions) show longer shipping reroutes raise costs but rarely sustain >$100 oil absent physical production cuts; insurance guarantees and U.S. naval escorts may reduce perceived tail risk faster than expected, creating a mean-reversion trade. Mispricings: tanker equities can gap higher but often sell off on headline de-escalation—buy on 15–25% pullbacks. Unintended consequence: visible U.S. escorts increase likelihood of escalation; size positions conservatively and horizon-weighted to avoid gap risk.
AI-powered research, real-time alerts, and portfolio analytics for institutional investors.
Request DemoOverall Sentiment
moderately negative
Sentiment Score
-0.40