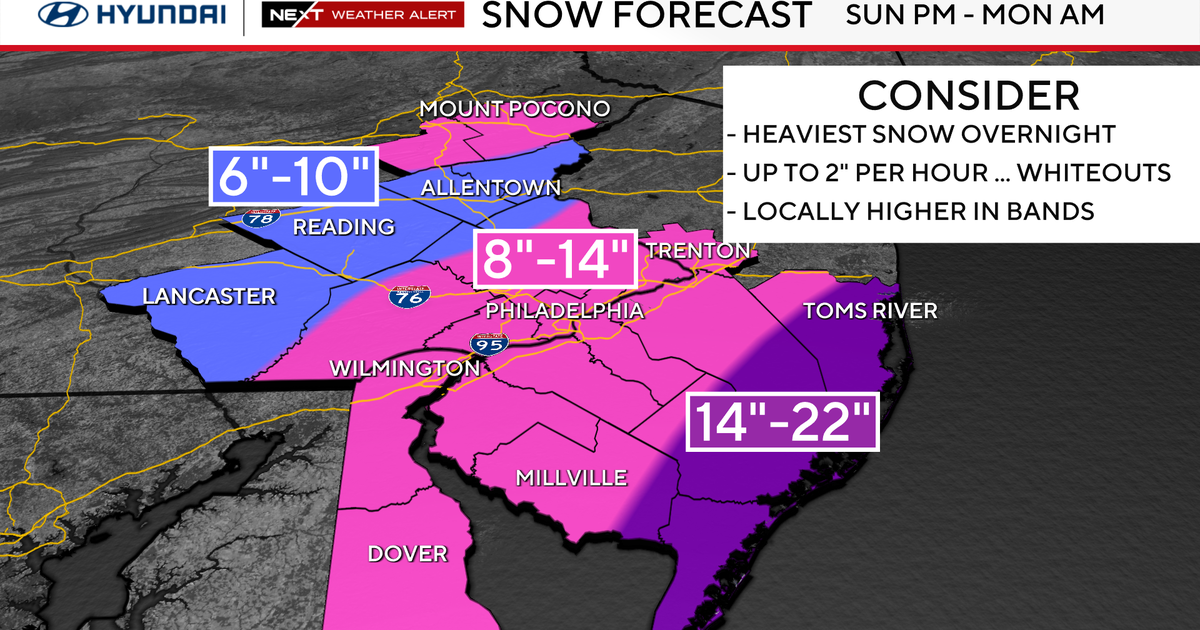
A rapidly intensifying bomb cyclone struck the Philadelphia region, producing record-like snowfall (about 13.7 inches at Philadelphia International Airport so far) and prompting state and city disaster declarations, travel bans, transit suspensions and coastal flooding warnings. The storm has produced major operational disruptions — roughly 600+ PHL flight cancellations, suspended Amtrak/NJ Transit/SEPTA services, and utility outage reports in the tens of thousands across multiple providers — creating immediate logistics, labor and revenue shocks for airlines, regional transit-dependent businesses, utilities and local retail/restaurant operators. Managers with exposure to regional carriers, airport services, municipal utilities, insurance, and local consumer-facing franchises should monitor near-term revenue misses, outage-related claims, supply-chain delays and potential incremental costs from emergency operations and recovery.
Market structure: Winners are grid and storm-recovery beneficiaries (utilities, heavy equipment suppliers, Home Depot/HD, snow‑removal contractors) and short‑term fossil fuel suppliers as heating/electric demand spikes. Losers are travel & logistics (airlines, airport services, NJ/PA commuter rails), food delivery (DASH) and discretionary leisure where cancellations and bans hit revenue for days. Larger utilities/contractors gain pricing power for emergency mobilization; small operators lose share due to scale and insurance/credit strain. Cross-asset: expect short-term Treasury rally (flight to safety), modest nat‑gas price uptick +5–15% if cold persists, and elevated equity vol in travel/delivery names.
Risk assessment: Tail risks include prolonged (>72h) blackout cascades, an escalation at Hope Creek prompting regulatory/regional demand shocks, or multiple storms causing supply interruptions for transformers (lead times 6–12 months). Immediate (0–7 days) effects are flight/train cancellations and revenue misses; short term (weeks–months) are insurance claims, repair costs and potential rate cases; long term (quarters–years) is accelerated utility capex and potential higher regulated returns. Hidden dependencies: crew availability, transformer inventories, and trucking capacity; catalysts include additional coastal flooding events or state/federal disaster funding decisions.
Trade implications: Direct plays — short DASH (DASH) 1–2% notional, horizon 2–6 weeks, exit if bookings recover to pre‑storm levels within 10 days or if guidance raised. Go long PPL (PPL) 2–3% targeting +8–12% in 3–6 months to capture storm‑recovery revenues/regulatory pass‑through; cut if regulator denies recovery or outages exceed 100k customers for >7 days. Pair trade — long HD 1–2% vs short JETS (airline ETF) 1–2% to capture DIY demand and travel weakness over 2–8 weeks. Options — buy a 4–6 week put spread on JETS (5% OTM) to hedge travel downside, size ~0.5% portfolio.
Contrarian angles: The market may over‑discount utilities — many have regulatory mechanisms to recover storm costs, so a measured long in high‑capex utilities can win if capex approval follows (3–12 months). DASH reaction could be overdone: temporary suspension implies lost gross bookings but pent‑up demand may create upside once service resumes — prefer short-dated (2–6 week) shorts rather than multi‑quarter. Historical parallel: 2016 East Coast blizzard produced transient travel weakness but durable uplift to retail and equipment suppliers; risk is mis‑timing exits. Key monitorables: statewide outage counts, FEMA disaster declarations, and natural gas weekly storage/price moves; act if outages exceed 100k customers statewide or nat‑gas +15% week‑over‑week.
AI-powered research, real-time alerts, and portfolio analytics for institutional investors.
Request DemoOverall Sentiment
moderately negative
Sentiment Score
-0.40
Ticker Sentiment
