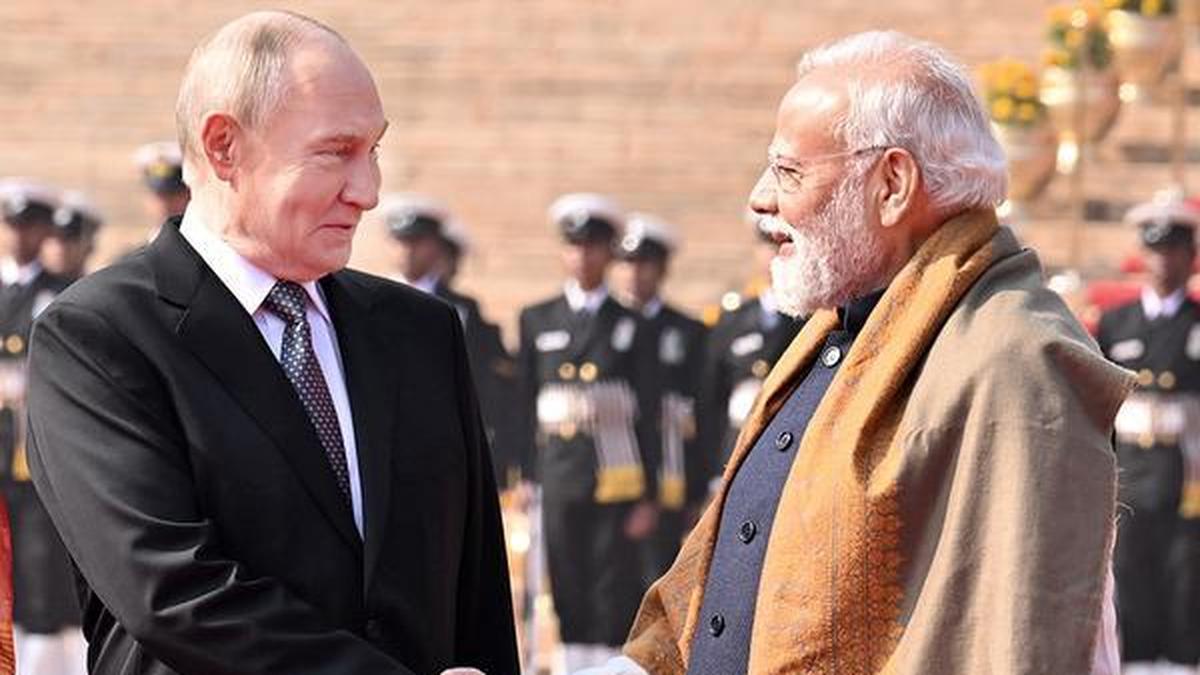
India and Russia focused on economic riffs rather than headline defence or energy deals during Vladimir Putin’s 30‑hour Delhi visit, advancing a 2030 economic cooperation roadmap and signing a labour‑mobility pact, a urea‑plant MoU and maritime/ports/customs agreements. Crucially there were no announcements on oil procurement—which comprised over $60bn of the $69bn bilateral trade last year—and Russia oil intake into India was down 38% year‑on‑year in October 2025, with Western sanctions (and CAATSA risk) and a 25% US tariff cited as constraints. The outcome preserves New Delhi’s strategic autonomy but signals limited near‑term deepening of defence, space, nuclear or energy ties, keeping policy and trade uncertainty elevated for investors with Russia/India exposure.
Market structure: The summit shifts emphasis from defence to economic links — winners are Indian ports/logistics, shipping corridors and labour-export agencies, and Russian fertilizer/Urea project contractors; losers include commodity traders relying on cheap sanctioned Russian crude to India (Russian crude flows to India were down ~38% y/y in Oct 2025). Expect pricing power to move to global oil sellers (Brent/Urals spread likely to widen) and to ports that control Chennai–Vladivostok and International North–South corridor volumes. Cross-asset: short-term upward pressure on Brent and freight rates, modest INR appreciation pressure if bilateral trade in INR/RUB increases; India sovereign credit should trade on progress of EU/US FTAs versus tariff frictions.
Risk assessment: Tail risks include U.S. re‑activation of CAATSA or secondary sanctions on Indian counterparties (low prob, high impact), and a breakdown of U.S.-led peace talks that hardens Western economic pressure on India (3–12 months). Immediate (days) risk: political signaling around upcoming EU/US visits; short-term (weeks–months): formal EU‑India FTA and tariff rollbacks; long-term (1–3 years): construction and commissioning of the urea plant and labour flows. Hidden dependencies: corridor economics depend on insurance/financial rails and willingness of banks to settle in INR/RUB; logistics upside is contingent on regulatory clearances and cargo insurance availability.
Trade implications: Tactical trades: 1) Establish a 2–3% long position in INDA (iShares MSCI India) into the expected EU‑India FTA signing within ~60 days, using a 3‑month call spread to cap cost. 2) Put on a 1–2% short RSX (VanEck Russia) or buy 3‑month puts — sanction and demand risk keeps downside asymmetric. 3) Take a 1–2% long in ADANIPORTS.NS or global ports ETF (e.g., HLPD/HAP) exposure; alternatively buy Freight/Shipping ETF (0.5–1%) to play corridor volume growth over 6–18 months. 4) Long Brent/USO (3–6 month horizon) sized 1–2% to capture upside from reduced discounted Russian flows.
Contrarian angles: Consensus assumes India will fully pivot West or fully embrace Russia; reality is calibrated hedging — India will diversify suppliers, not sever ties, creating prolonged market bifurcation and choppy flows. Mispricing: RSX may be oversold given a potential diplomatic détente (if peace talks progress) — asymmetric rebound possible; buy inexpensive 6‑month call spreads as optionality. Historically, non‑aligned trade patterns can persist for years; unintended consequences include accelerated China–Russia economic integration that could reroute volumes away from planned corridors — hedge corridor plays with 6–12 month stop losses.
AI-powered research, real-time alerts, and portfolio analytics for institutional investors.
Request DemoOverall Sentiment
moderately negative
Sentiment Score
-0.25
