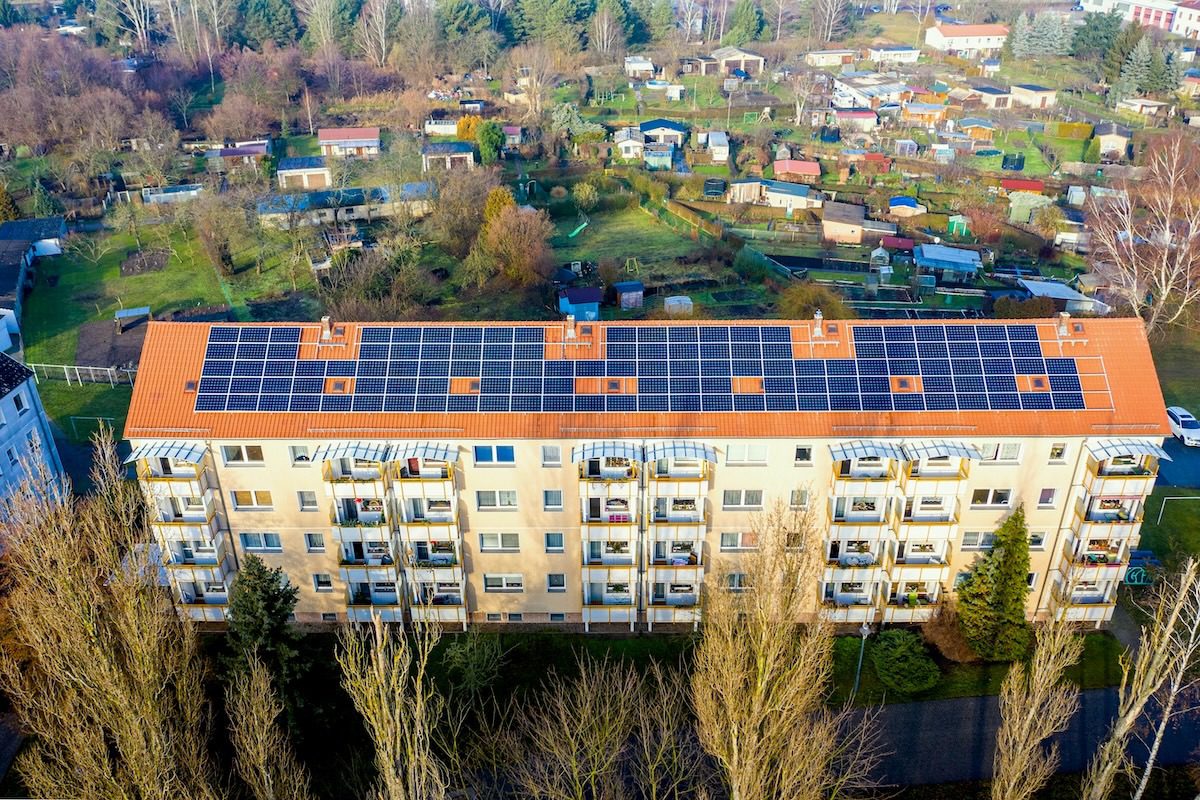
Wind and solar generated a record 30% of EU power last year versus 29% from fossil fuels, driven by rapid solar deployment and pushing renewables (including hydro) to nearly half of EU generation in 2025. Solar supplied over 20% of power in Hungary, Cyprus, Greece, Spain and the Netherlands, while coal fell below 5% in 19 countries and Ireland and Finland retired their last coal plants in 2025. Drought slightly reduced hydro output, causing a rise in gas-fired generation and highlighting continued reliance on imported gas that pressures prices and geopolitical vulnerability; increasingly cheap batteries are beginning to displace gas in evening peak hours, which could reduce future gas demand and price volatility.
Market structure: Wind+solar hitting 30% vs fossil 29% is a structural kink — marginal-cost-free solar captures daytime wholesale price peaks and transfers value to asset owners, inverters (ENPH, SEDG), and battery/storage developers (AES, NEE). Winners: utility-scale solar developers, storage integrators, grid/connection equipment; losers: merchant gas peakers, LNG exporters and coal miners as utilization and spark spreads compress. Supply/demand: midday oversupply will depress baseload prices by an incremental 10–30% on sunny days, while evening demand increasingly bids for storage capacity rather than fuel-run generation.
Risk assessment: Tail risks include a cold snap or drought-driven hydro drop that could spike TTF gas prices >€40/MWh within days, regulatory reversals on renewables subsidies, or a lithium/supply-chain shock raising battery costs >20% and delaying deployments. Immediate (days) volatility will track weather/gas; short-term (3–12 months) depends on announced battery deployments and EU gas-stock policy; long-term (2–5 years) favors storage if battery cost curves continue ~15–25%/yr declines. Hidden dependencies: permitting/grids and mining inputs (lithium, nickel, polysilicon) are single points of failure that lengthen commercialization timelines.
Trade implications: Constructive bias to solar and storage equities/ETFs and selective lithium exposure, with tactical shorts of LNG exporters and coal miners. Use pair trades to be long asset owners (TAN/ENPH) vs short gas-exposed names (LNG, CH4-linked equities) to capture compressing spark spreads. Options: buy defined‑risk call spreads on high-convexity solar names and put spreads on LNG to limit downside while keeping upside optionality. Timing: initiate on any 5–10% pullback or within 1–3 months as EU winter/drought data clarify gas demand.
Contrarian view: Consensus underprices grid/permitting friction — renewables growth could be stepwise not smooth, delaying storage payback and leaving gas residual demand for 1–3 years. Lithium miners are partially priced for perpetual demand growth; inventory and new-supply timelines could produce 20–40% downside in some names if spodumene oversupply occurs. Unintended consequence: collapsing merchant prices will force accelerated capacity markets and M&A among utilities, creating idiosyncratic takeover targets.
AI-powered research, real-time alerts, and portfolio analytics for institutional investors.
Request DemoOverall Sentiment
mildly positive
Sentiment Score
0.28
