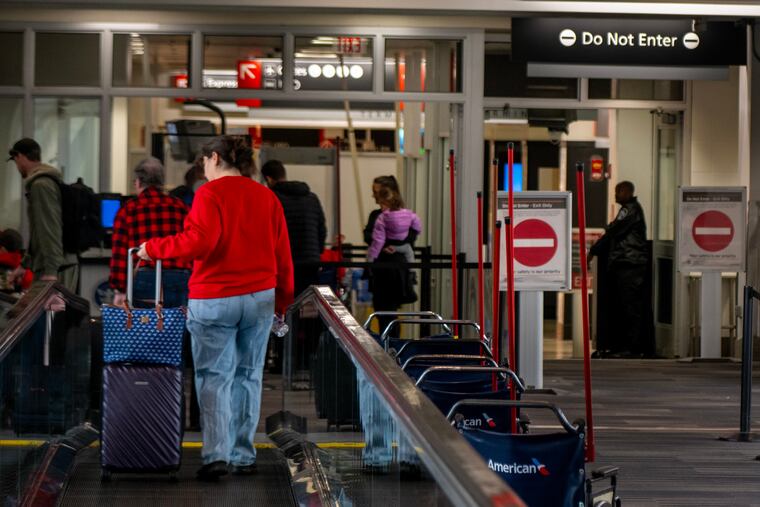
AAA projects more than 8 million air travelers between Dec. 20–31, up 2.3% year-over-year, creating a potential record holiday surge; Philadelphia International Airport (PHL) has handled the season relatively smoothly with roughly 81% of December flights on time. Peak disruptions included Dec. 14 when only 36% of flights were on time due to snow, and following-Thanksgiving delays that quickly abated; PHL services 15 carriers and posts hourly operational and security information. Continued weather or volume-driven disruptions could pressure airline operational performance and near-term revenue per available seat mile for affected carriers, but the item is primarily operational travel news rather than market-moving financial data.
Market structure: The modest national rise in year‑end flyers (AAA: ~8M travelers, +2.3% YoY) benefits demand-sensitive nodes — online travel agencies (BKNG, EXPE), ground transport and airport concessions — while concentrated hub carriers (American Airlines, AAL) face asymmetric operational risk if PHL or other Northeast hubs degrade. PHL-level data (Dec month on‑time ~81%; worst day 36% during snow) implies capacity is tight: a single multi-day storm can flip load factors and force costly re-accommodation, protecting pricing for surviving itineraries but compressing airline margins via disruption costs and IRROPs.
Risk assessment: Tail risks include a multi-day Northeast storm or systemic TSA staffing failure that produces >50% cancellation windows and forces carriers to absorb multi-hundred‑million dollar re-accommodation costs over a week; jet fuel spikes (+5–10% in 1–2 weeks) are another tail. Immediate (days): booking volatility and option IV spikes; short (weeks): flow of refunds/claims and Q1 demand mix changes; long (quarters): potential regulatory responses (compensation rules) that raise unit costs. Hidden dependency: de‑icing crew and gate availability — not plane supply — will be the choke point for PHL outages.
Trade implications: Favor asset classes insulated from on‑airport ops: establish a 0.5–1% tactical long in BKNG/EXPE ahead of booking flow, and consider 0.5–1% long in refiners (VLO/MPC) or ULSD if crude/jet fuel moves up >5% in two weeks. Hedge airline operational exposure: buy AAL Jan put spreads (long 25–30 delta, short 15 delta) sized 0.5% and increase if PHL on‑time <70% for 48 hours. Use a small volatility play (JETS ETF calls or straddle, 0.25–0.5%) to monetize holiday IV.
Contrarian view: The market assumes durable travel recovery, but operational constraints (staffing, de‑icing, gate throughput) are the binding limit and are underpriced — airlines’ stock returns may lag OTAs and refiners if disruptions recur. Past parallels (severe winter storms 2014–2019) show short sharp hits to airline EPS but limited OTA downside; if PHL posts consecutive days <70% on‑time, expect outsized negative re‑rating for hub carriers and incremental re-pricing in options markets.
AI-powered research, real-time alerts, and portfolio analytics for institutional investors.
Request DemoOverall Sentiment
neutral
Sentiment Score
-0.05
