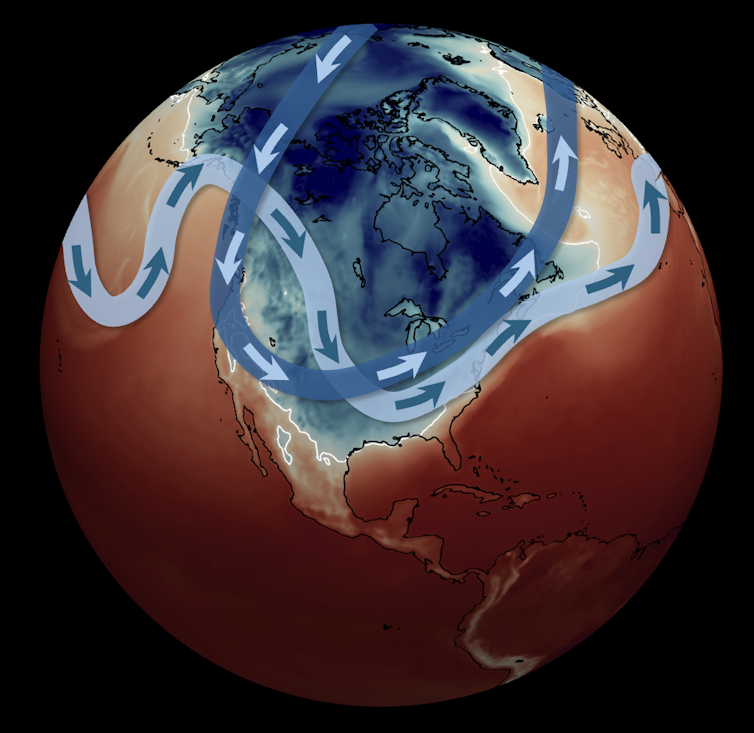
A severe late-January 2026 winter storm swept from New Mexico to New England, knocking out power for hundreds of thousands across the South, dropping more than a foot of snow in parts of the Midwest and Northeast, and producing widespread freezing rain and sleet. Scientists link the event to a southward stretch and disruption of the stratospheric polar vortex combined with moisture from a warm Gulf of Mexico and suggest Arctic warming may be increasing vortex disruptions and storm intensity; infrastructure vulnerabilities and potential impacts to energy demand and transport logistics are key near-term risks, while funding cuts to federal research (e.g., NCAR) could weaken longer-term forecasting capacity.
Market structure winners are grid-hardening and heavy-equipment suppliers (Eaton ETN, ABB) and midstream/thermal fuel providers (Cheniere LNG L N G, Kinder Morgan KMI, Williams WMB) because immediate demand for replacement transformers, diesel, and gas heating can lift revenues 5–15% regionally over 1–3 quarters. Losers include regional P&C insurers (Travelers TRV, Allstate ALL), regional airlines and freight carriers (small caps) facing cancellation losses, and utilities with fragile local networks facing political/regulatory scrutiny; pricing power shifts toward capital goods and contractors who can meet 3–12 month lead times.
Tail risks: multi-day, wide-area grid outages causing supply-chain stoppages and municipal fiscal strain (municipal issuance +1–3% yield widening) or a major reinsurance shock that widens insurer CDS by 50–200bps. Immediate effects (days): spikes in spot natural gas and diesel; short term (weeks–months): insurance claims and municipal capital needs; long term (quarters–years): sustained grid capex and higher utility rate cases. Hidden dependencies include transformer lead times (6–18 months), labor shortages for restoration, and federal research funding cuts (NCAR) degrading medium-term forecast accuracy.
Trade implications: prefer 3–6 month plays on energy and equipment versus insurance pain. Use a 3-month call spread on Henry Hub futures (bullish if HH > $4.50/MMBtu) or buy Cheniere (LNG) 6–9 month calls; establish 2–3% long positions in ETN and Jacobs (J) to capture accelerated capex. Pair trade: long ETN (2%) / short TRV (1.5%) for 6–12 months to express structural demand vs near-term claims risk; size options to limit downside to 2% portfolio risk.
Contrarian angles: the market may underprice durable capex upside—after 2013 Polar Vortex utility capex and contractor revenues rose for multiple years; some insurers are oversold relative to reserve adequacy and could rebound if losses remain within catastrophe buffers. Monitor Henry Hub > $5.00, NOAA polar-vortex indices, and insurer combined ratios >105% over next 60–120 days as triggers to add/remove exposure; be wary that political pressure can accelerate permitting and benefit contractors faster than models expect.
AI-powered research, real-time alerts, and portfolio analytics for institutional investors.
Request DemoOverall Sentiment
moderately negative
Sentiment Score
-0.30
