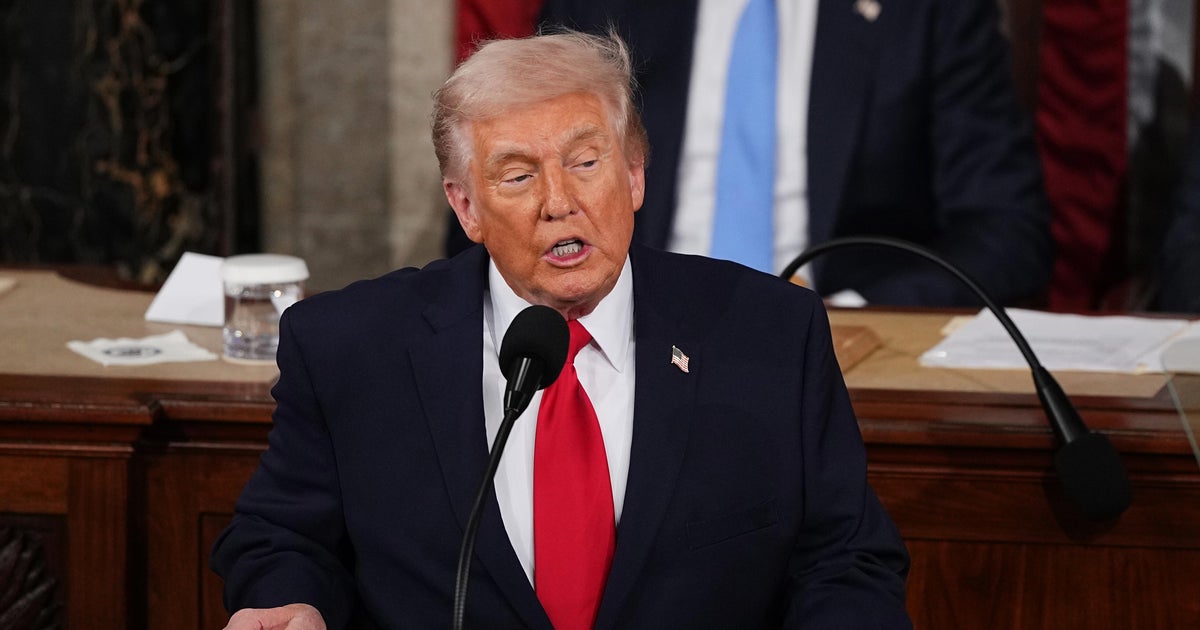
President Trump used the 2026 State of the Union to tout a one-year economic turnaround and push for additional personal and corporate tax cuts, a permanent ban on large Wall Street firms buying single-family homes, and a ‘rate‑payer protection plan’ including deals with tech/AI companies. The speech comes amid a partial Department of Homeland Security shutdown and heightened uncertainty over potential military action against Iran following classified briefings—factors that could drive episodic market volatility but are unlikely to move markets materially absent concrete legislative action or military operations.
Market structure: The SOTU signals concentrated policy risks — potential personal and corporate tax cuts, restrictions on institutional single-family home purchases, and headline tail-risk on Iran. Winners ex-ante: defense (LMT, RTX, GD), energy (XLE/crude) and banks if deficit-driven rates rise; losers: institutional SFR owners (INVH, AMH), rate-sensitive utilities and long-duration growth. Cross-asset: short-term safe-haven bids into Treasuries/OUSD on geopolitical headlines, medium-term upward pressure on 10y yields if fiscal expansion looks credible, higher oil volatility on any Iran escalation.
Risk assessment: Tail scenarios — limited strike on Iran (3–6 week oil/vol spike, +$15–$30/bbl), Congress passes meaningful tax cuts (12–24 month fiscal shock → +20–40bp 10y), or DHS funding stalemate prompting market volatility. Horizon: immediate (0–30 days) geo headlines drive energy/defense/Treasuries; short (1–6 months) legislative deadlock or progress affects banks, REITs, equities; long (6–24 months) structural inflation/deficit dynamics. Hidden dependency: Fed response — any fiscal push likely met by tighter Fed policy, offsetting real-income gains and pressuring equities.
Trade implications: Tactical (0–90d): buy 1–3% directional exposure to defense (LMT) and energy call skew (XLE 1–2 month call spreads) as hedge against Iran headlines; buy 3–6 month protection (puts) on INVH/AMH sized 1–2% to express policy risk to SFR model. Relative/value: long regional bank ETF KRE (2%) vs short VNQ mortgage-heavy REITs (1–2%) to capture steeper yield curve/REIT compression. Use 2–3% notional sizing and 20–25% downside stops.
Contrarian angles: Consensus treats tax cuts as probable; market may underprice legislative friction — betting on broad tax-driven multiple expansion is high-risk. The institutional SFR ban could temporarily reduce supply of rental upgrades, boosting rents and cap rates — a potential short-squeeze in select REITs. Historical parallel: 2017 tax euphoria faded into Fed tightening; similar outcome likely if Congress and Fed both react, creating mispricings in banks vs long-duration growth.
AI-powered research, real-time alerts, and portfolio analytics for institutional investors.
Request DemoOverall Sentiment
neutral
Sentiment Score
0.05
