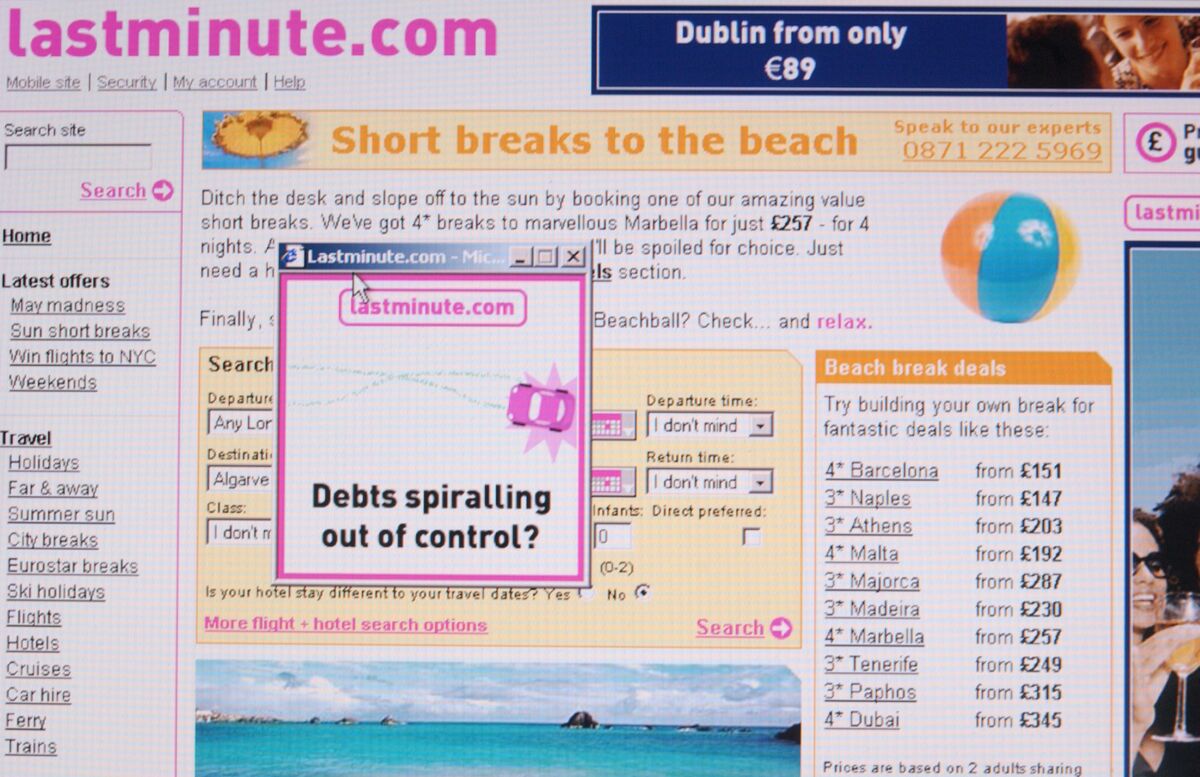
John Stepek examines parallels between the current AI-driven market exuberance and the dotcom bubble, framing the discussion around what investors can do in either scenario. The excerpt is an introductory note for a subscriber-only newsletter and contains no company-level data, earnings, or specific market moves, instead signaling a thematic comparison and investor-focused analysis of AI-related market risks and opportunities.
Market structure: The AI wave concentrates economic surplus to hyperscalers (MSFT, GOOGL, AMZN) and GPU leaders (NVDA, AMD) while commoditizing smaller AI apps that lack moats; expect 60–80% of incremental cloud/AI spend to flow to the top 6 suppliers over next 12–24 months. Pricing power shifts toward vertically integrated stacks (chips+cloud+models); legacy software vendors face margin pressure unless they rapidly embed models and subscription monetization.
Risk assessment: Tail risks include US/EU export controls or antitrust actions that could cut GPU/AI model access (probability ~15% next 12 months) and a large model failure/data/privacy fine (> $5–10bn scenario) that shocks multiples. Immediate (days) risk is speculative flow and gamma squeezes; short-term (weeks–months) driven by earnings and inventory cycles (GPU supply typically lags demand by 3–6 months); long-term (years) driven by productivity gains and capex intensity of data centers.
Trade implications: Favor large-cap, cash-generative tech and infrastructure: NVDA, MSFT, GOOGL, AMT/EQIX, TSM over speculative small-cap AI plays; use pair trades (long NVDA vs short ARKK) and options to control timing—buy 9–12 month LEAP calls on NVDA and sell 1–2 month call spreads into earnings to monetize IV. Rotate out of small-cap AI names and high-burn software (names in small-cap AI index or ARKK-like ETFs) into data-center REITs and select semicap equipment (ASML, LRCX) over 3–9 months.
Contrarian angles: Consensus underprices supply constraints and energy/copper demand from data center build-outs—copper and power suppliers may see earnings upgrades 12–24 months out. The reaction may be overdone in speculative small caps ( >100% YTD rallies) and underdone in balance-sheet-light infra (AMT/EQIX trading at <15x FFO is a buying opportunity if yields remain <5%). Historical parallel: 1999–2001 saw infrastructure survivors dominate after the bust; this time real, monetizable AI revenue reduces extinction risk but increases concentration risk to regulation and supply-chain chokepoints.
AI-powered research, real-time alerts, and portfolio analytics for institutional investors.
Request DemoOverall Sentiment
neutral
Sentiment Score
0.00
