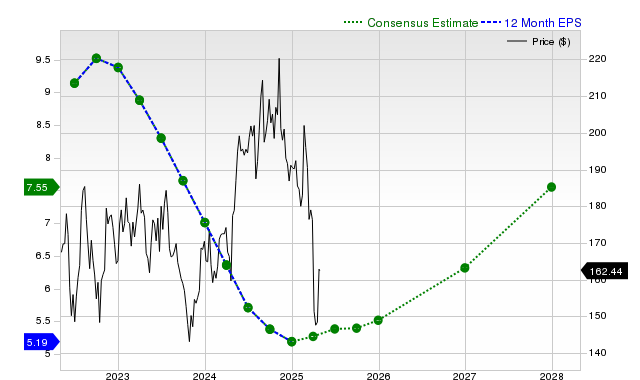
Texas Instruments' latest Zacks analysis highlights modest near-term headwinds: consensus for the current quarter EPS is $1.28 (-1.5% YoY) and full-year EPS of $5.46 (+5% YoY), while next fiscal year consensus is $5.97 (+9.3%). The company reported last-quarter revenue of $4.74 billion (+14.2% YoY) and EPS of $1.48 (beat consensus modestly), but recent downward revisions (30‑day changes up to -2.9%) and a Zacks Rank #4 (Sell) plus a Value Style Score of D signal valuation premium and potential near-term underperformance. Managers should note the mixed fundamental beats against weakening estimate trends when sizing positions in the stock.
Market structure: The Zacks signal and minor estimate downgrades point to near-term demand normalization for analog chips — winners are AI/high‑performance ASIC makers (NVDA) and bespoke foundry/service providers; losers are mid‑cycle analog names trading rich (TXN). TI retains structural pricing power in industrial/auto analogs, so market‑share losses are unlikely but cyclical revenue growth will reprice more closely to 5–10% y/y growth expectations over the next 2–4 quarters. Cross‑asset: equity implied volatility in semis should tick +20–40% around earnings; corporate credit spreads for mid‑cap suppliers could widen 10–30bps if inventories reaccelerate; USD strength would shave ~100–200bps off reported revenue growth for multinationals over a year.
Risk assessment: Tail risks include a sharp auto/industrial slowdown (−15–25% organic demand) or new export controls hitting GPU supply chains — either could compress TXN/NVDA revenues by double digits in 2–6 months. Immediate (days) moves will be driven by analyst revisions and order guides (±5–8%); short term (weeks–months) by inventory digestion and macro PMIs; long term (quarters–years) by AI capex concentration and TI’s buyback cadence. Hidden dependencies: TXN’s FCF and buybacks can mask weakening end‑market demand; channel inventory swings may lag sell‑in by 2–3 quarters. Key catalysts: TXN quarterly guide, NVDA datacenter commentary, ISM PMIs, and semi capex cadence reports.
Trade implications: Tactical short bias on TXN into the next 30–90 days is warranted while preserving optionality — use 3‑month puts ~5–8% OTM or small cash short (~2–3% notional) with a +6% stop; target −10–15% downside on miss. Relative value: run a 1:1 pair (long NVDA calls 3–6 month call spread, sell TXN stock or buy puts) to express AI outperformance vs analog cyclicality; expect 3–6 month relative alpha of 8–20%. Rotate 2–4% portfolio weight out of broad semis into industrials/auto suppliers with stronger forward orders; buy short‑dated protection ahead of TXN earnings within 30–45 days.
Contrarian angles: Consensus focuses on estimate downgrades but underweights TI’s cash generation and buyback support — if TXN reports resilient margins and raises buyback cadence, a sharp mean reversion rally (≥10% in 1–3 months) is possible and will squeeze shorts. Reaction may be overdone for long‑term buy‑and‑hold investors; consider layering buys on >10% pullback with 6–12 month horizon. Historical parallel: 2016–2017 analog inventory rebalancing showed quick rebounds once end‑demand held; downside is funding‑driven, not structural, unless AI capex collapses.
AI-powered research, real-time alerts, and portfolio analytics for institutional investors.
Request DemoOverall Sentiment
mildly negative
Sentiment Score
-0.28
Ticker Sentiment
