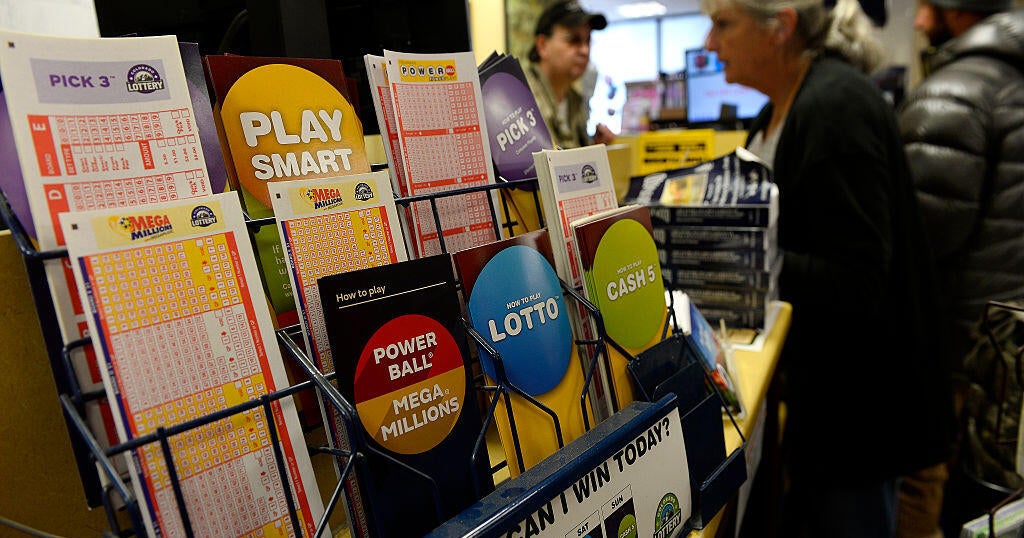
Powerball announced winning numbers for an estimated $1.5 billion jackpot (the game's fifth-largest) — 4, 5, 28, 52, 69 with Powerball 20 — with an estimated lump-sum cash value of $686.5 million. The drawing was the 45th since the last jackpot was won (the longest run), odds of a top prize are 1 in 292.2 million, tickets cost $2 and are sold in 45 states plus D.C., Puerto Rico and the U.S. Virgin Islands; no immediate jackpot winner was reported. A single winner could opt for the $686.5M lump sum or a 30-year annuity with a 5% annual increase.
Market structure: Mega-jackpots concentrate transient consumer attention and produce measurable, short-lived volume uplifts at retail points of sale (convenience stores, grocery chains and fuel stations). Historically ticket sales can rise ~20–30% during mega-jackpot weeks and drive incremental basket visits (fuel, snacks) over 48–72 hours, favoring high-lottery-exposure retailers (e.g., CASY, WMT, KR) while having negligible structural effect on national media or payments firms.
Risk assessment: Tail risks are regulatory (state-level lottery rule/tax changes) and operational (winner disputes, retailer payout frictions) — both low probability but can compress retailer margins locally; duration of impact is immediate (days) and fades over weeks. Hidden dependencies include state budget reporting cycles (lottery revenue flows into muni budgets) and winner capital allocation choices (a lump-sum winner could modestly reallocate into fixed income/equities over months).
Trade implications: The cleanest short-term alpha is retail foot-traffic arbitrage: long high-lottery-exposure c-stores/grocers for 1–3 trading days around the drawing and unwind within 1–2 weeks; use call spreads to cap cost. Cross-asset impacts are tiny; no meaningful move expected in FX, commodities or sovereign bonds, though localized muni receipts should be watched for 30–90 days.
Contrarian angle: The market often overestimates national-media winners and underweights micro-retailer beneficiaries — consensus neglects that regionals with concentrated rural coverage (CASY) see outsized ticket share. The reaction is likely underdone for these small regional names and overdone for national media narratives; the real read-through requires daily POS/traffic data over the next 3–10 days, not headlines.
AI-powered research, real-time alerts, and portfolio analytics for institutional investors.
Request DemoOverall Sentiment
neutral
Sentiment Score
0.05
