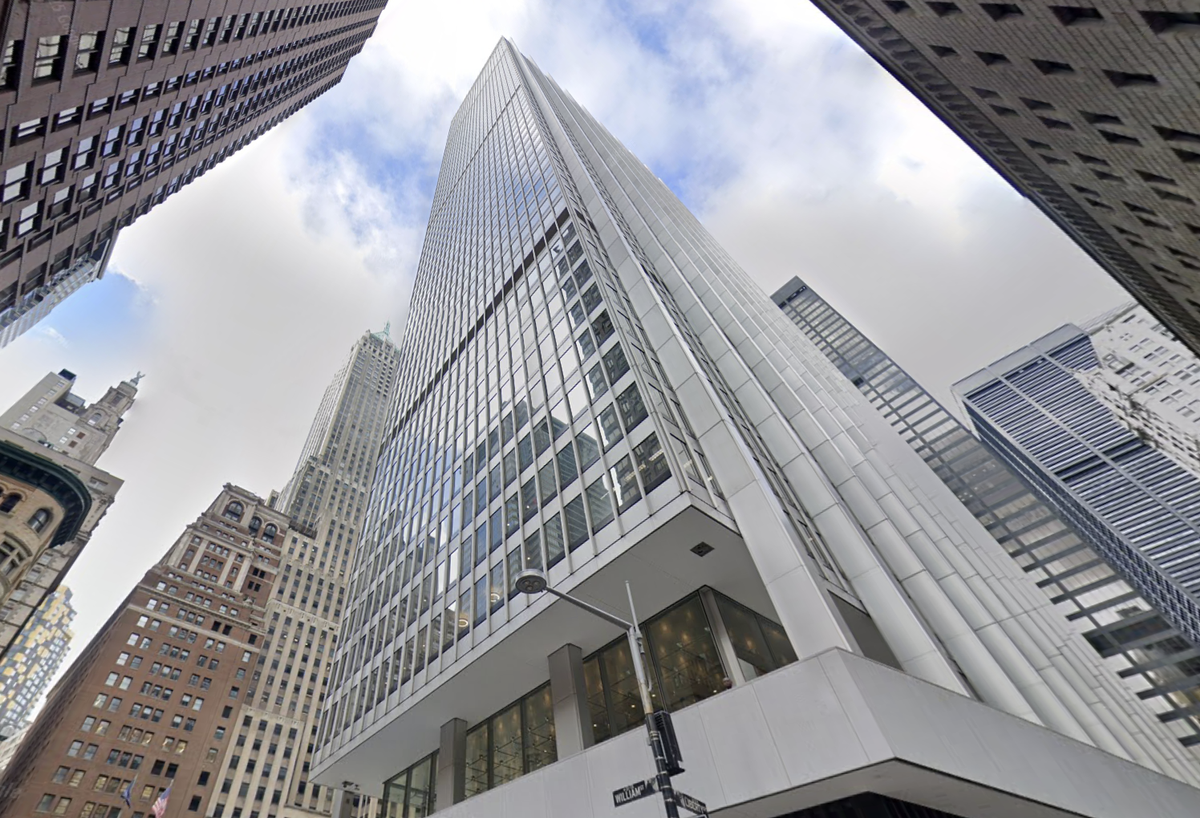
Manhattan office leasing surged to roughly 43M SF in 2025 — the most since 2014 and about 20% above 2024 — while availability fell to 13.9% from 16.5%, aided by roughly 2.1M SF removed for conversions and 7.3M SF exiting the sublease market (a ~40% reduction). Top-tier dynamics tightened materially: Midtown trophy availability is 3.4%, trophy asking rents rose 12% to $191/SF, Class-B asking rents hit a record $68.61/SF in Q4, and 70% of Q4 leases were in trophy/Class-A buildings. Large transactions (e.g., Moody’s 460K SF, NY AG 378K SF) plus 1M SF leased by AI firms and new tower groundbreakings signal growing landlord leverage and a momentum that could influence REITs, landlords and office-focused credit into 2026 despite lingering high-rate and localized distress risks.
Market structure: Landlords of top-tier Manhattan offices and brokers are clear winners — trophy vacancy at ~3.4% and asking rents +12% YoY to $191/SF shows concentrated pricing power; Colliers’ availability down to 13.9% (from 16.5%) and 7.3M SF removed from sublease (-40%) create a near-term supply squeeze, benefiting REITs with prime assets (BXP, SLG) and brokerage fees (CIGI). Tech and AI demand (≈1M SF) and large corporate renewals (Moody’s 460k SF) diversify tenant mix, reducing single-sector risk but concentrating activity in Midtown South and Downtown.
Risk assessment: Tail risks include a Fed-driven rate shock that re-prices cap rates (a +100bp move could widen cap rates by ~75–125bp for leveraged REITs), a recession-driven rollback in leasing, or a rapid relisting of sublease inventory if companies reverse expansion plans; refinancing cliffs for office owners with >20–30% debt maturing by 2026–27 are the primary financial hazard. Short-term (0–3 months) sensitivity centers on Q1 2026 leasing prints and Fed comments; medium-term (3–12 months) on occupancy trends and conversions; long-term (2–5 years) on supply additions (new towers) versus conversions.
Trade implications: Favor active long exposure to high-quality office landlords and brokers: BXP and CIGI as liquidity/earnings plays, and selective construction suppliers (steel/cement) for midcycle upside, while underweighting highly-levered office landlords. Use relative-value pairs (long BXP/short VNO or other high-leverage office REITs) and options to limit downside — 6–12 month call spreads or protective puts for positions sized 1–3% portfolio each. Entry window: scale in over next 2–8 weeks; trim if Manhattan availability reverts above 15% or trophy vacancy rises >1ppt QoQ.
Contrarian angles: Consensus may underprice conversion-driven scarcity and trophy rent durability — which can support NAVs and dividends, but it may also overvalue all office names indiscriminately; weaker suburban/Class-C owners could lag despite headline rent growth. Historical parallel: partial recoveries (post-2010) showed concentrated outperformance in prime assets while secondary stock lagged for years; unintended consequence: accelerated building starts (Related/BXP) could create a 3–5 year oversupply risk in trophy space, so monitor new construction starts and leasing velocity as leading indicators.
AI-powered research, real-time alerts, and portfolio analytics for institutional investors.
Request DemoOverall Sentiment
moderately positive
Sentiment Score
0.45
Ticker Sentiment
