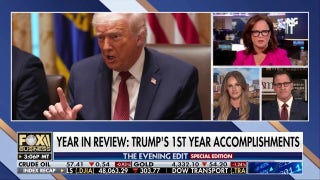
U.S. economic indicators under President Trump show stronger growth and cooling inflation: third-quarter output rose at roughly a 4–4.5% annual pace and November CPI was +2.7% year-over-year (below a 3.1% estimate), while the S&P 500 returned about +17% in 2025. Major policy moves include the One Big Beautiful Bill Act (signed July 4) that extends 2017 TCJA cuts, makes lower individual rates permanent and is expected to produce unusually large refunds ($1,000–$2,000 projected by Treasury officials and echoed by the Tax Foundation) in the upcoming filing season. New child-focused “Trump accounts” (up to $5,000/year contributions; employers up to $2,500) have attracted large private pledges (Michael and Susan Dell >$6bn; Ray Dalio joined), and aggressive “Liberation Day” tariffs have driven $215.2bn in duty revenue in FY2025 (plus $96.5bn since Oct. 1) but face a Supreme Court challenge over presidential tariff authority. These fiscal and trade shifts, together with Fed rate-cut expectations (CME FedWatch pricing a first cut in April 2026), create a cautiously constructive backdrop for risk assets while introducing policy and legal tail risks for sector positioning.
Market structure: The OBBBA tax cuts + large expected Q1 2026 refunds (Treasury/Tax Foundation estimates $1k–$2k per household) are a near-term demand shock for consumer discretionary (XLY) and autos; simultaneous ‘‘Liberation Day’’ tariffs shift margin and market share toward domestic manufacturers (NUE, X) and materials (XLB) while pressuring import-dependent retailers (TJX, KSS). Tariffs compress global supply elasticity, raising input-cost pass-through risk and boosting pricing power for U.S. steel/industrial names; duty receipts ($215B FY25 + $96.5B into FY26) materially alter fiscal flows if sustained.
Risk assessment: Immediate tail risks include a Supreme Court ruling in January nullifying presidential tariff authority (sharp unwind for tariff beneficiaries) and legal/retaliatory escalation from trading partners; medium risk is that tariffs drive higher CPI and delay the Fed’s expected April 2026 cut. Hidden dependencies: consumer stimulus depends on withholding patterns and marginal propensity to consume; corporate hedging/capital expenditure decisions could lag by quarters. Key catalysts: Jan SCOTUS decision, monthly tariff-revenue/CPI prints (Jan–Mar), and the April FOMC.
Trade implications: Tactical long XLY (2–3% portfolio) into Q1 2026 to capture refund-driven sales, paired with selective shorts in import-heavy retail (short TJX 1–1.5%). Position in domestic industrials (long NUE 1.5–2%) to play tariff beneficiaries; buy duration (TLT 1.5–2%) as a hedge for an April Fed cut, with a 10Y-yield stop at >4.5%. Use options: buy a Jan 2026 straddle on XRT (retail ETF) sized <1% notional to capture binary SCOTUS/event risk and retail re-rating around refunds.
Contrarian angles: Consensus assumes tariffs stick and Fed cuts occur; the market may be underpricing the scenario where tariffs raise CPI enough to push the Fed past April — that would hurt long-duration and consumer cyclicals. Conversely, a court strike-down would aggressively re-rate domestic-capex names downward; historical 2018 tariff actions produced cost shocks to retailers and only gradual manufacturing gains, implying mean reversion risk for tariff beneficiaries. Monitor tariff-revenue trend (monthly) and Feb CPI retail-sales elasticity as early mispricing signals.
AI-powered research, real-time alerts, and portfolio analytics for institutional investors.
Request DemoOverall Sentiment
mildly positive
Sentiment Score
0.28
