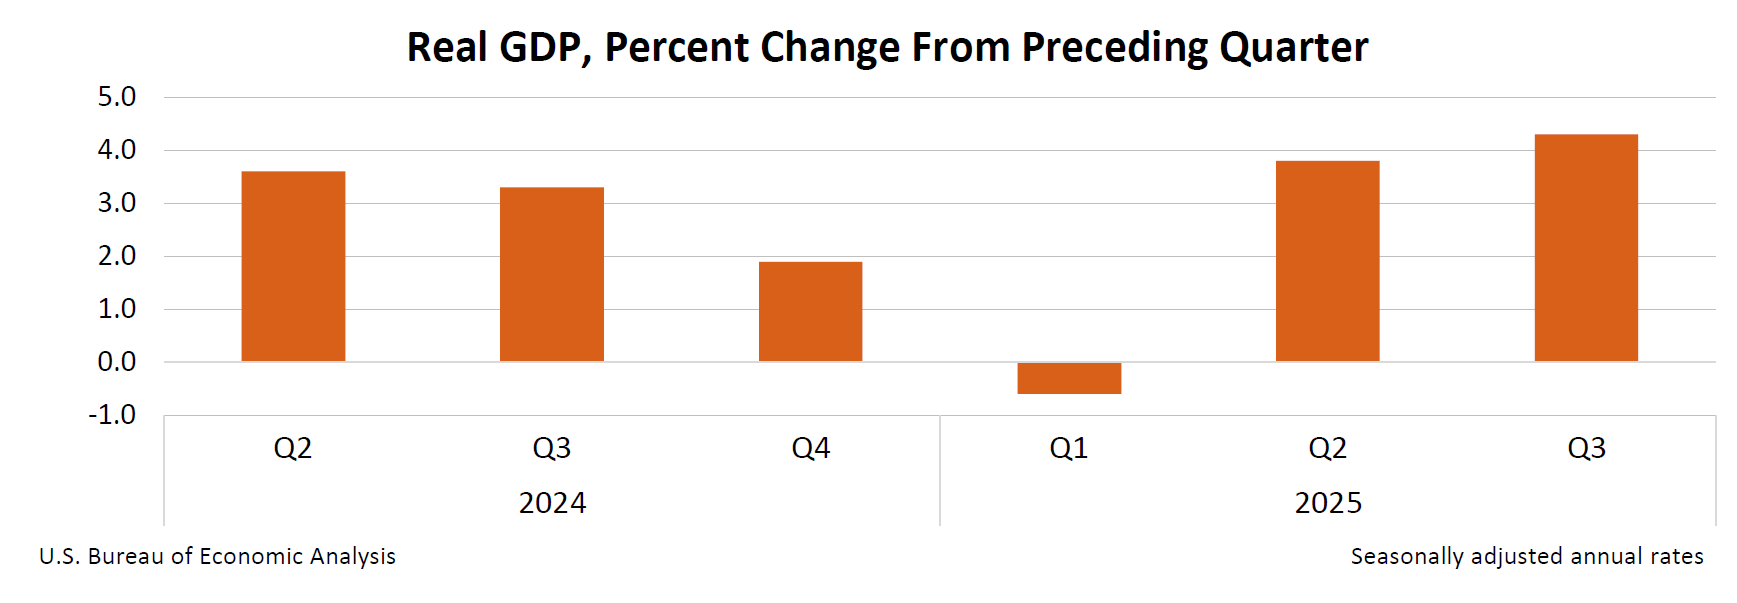
Real GDP rose 4.3% annualized in Q3 2025 (1.1% quarterly), accelerating from 3.8% in Q2, driven by consumer spending, exports and government spending while investment fell and imports declined. Inflation measures firmed — the gross domestic purchases price index +3.4%, PCE +2.8% and core PCE +2.9% — and real GDI rose 2.4%; corporate profits jumped by $166.1 billion despite several large settlements (notably $2.8B and $2.5B). The release substitutes for BEA’s delayed advance/second estimates because of the federal shutdown, a caveat for data vintage and subsequent revisions ahead of the January update.
Market structure: 4.3% annualized GDP (1.1% q/q) with consumer services, recreational goods, health care and capital goods exports as engines implies clear winners: hospital/outpatient operators, large-cap pharma with pricing power, industrial capital-goods suppliers and defense contractors. Losers are inventory-heavy wholesale/manufacturing and import-dependent nondurable retailers where inventory drawdown and lower imports compress near-term sales. Services-led growth lifts pricing power in health and business services (core PCE 2.9%), supporting margin resilience in selected service providers.
Risk assessment: near-term (days–weeks) the market should be risk-on; medium-term (1–3 months) watch corporate earnings revisions from inventory draws and NIPA settlements that can swing profits; long-term (quarters) capex-led growth hinges on sustained export demand and inventory rebuilds. Tail risks: Fed tightening if core PCE breaches 3.0% (trigger for >25bp hike probability increase), geopolitical/trade shocks that reverse export strength, and accounting-driven profit revisions from additional settlements. Hidden dependency: BEA used mixed source data due to shutdown — Q1 2026 revisions could materially revise sector exposures.
Trade implications: tactical overweight industrials (CAT, DE) and large hospital operators (HCA) for 2–3% portfolio positions, plus selective defense exposure (LMT/RTX) for 1–2% positions; short 0.5–1% positions in inventory-levered wholesalers/retailers (RGR/selected small-cap distributors) and consider 3–6 month call spreads on CAT and LMT (buy ITM/near-ATM spreads) to capture capex/export upside. Pair trades: long HCA vs short WMT (healthcare services outperformance vs big-box retail with inventory risk). Risk management: cut cyclicals if 10Y >4.5% or core PCE >3.0%.
Contrarian angles: consensus applauds GDP print but underestimates inventory drag — if Q4 shows inventory rebuild failure, cyclical earnings could roll over; profits spike partly reflects one-offs and settlements so forward margins may be overstated. Historical parallel: inventory-led expansions often reverse (early-2000s, 2015 cyclical corrections), so size positions conservatively and hedge with short-duration fixed income or buying puts on cyclical ETFs. Unintended consequence: a stronger dollar from growth without Fed cuts would compress export margins — monitor USD vs EUR/EM crosses over next 90 days.
AI-powered research, real-time alerts, and portfolio analytics for institutional investors.
Request DemoOverall Sentiment
mildly positive
Sentiment Score
0.35
