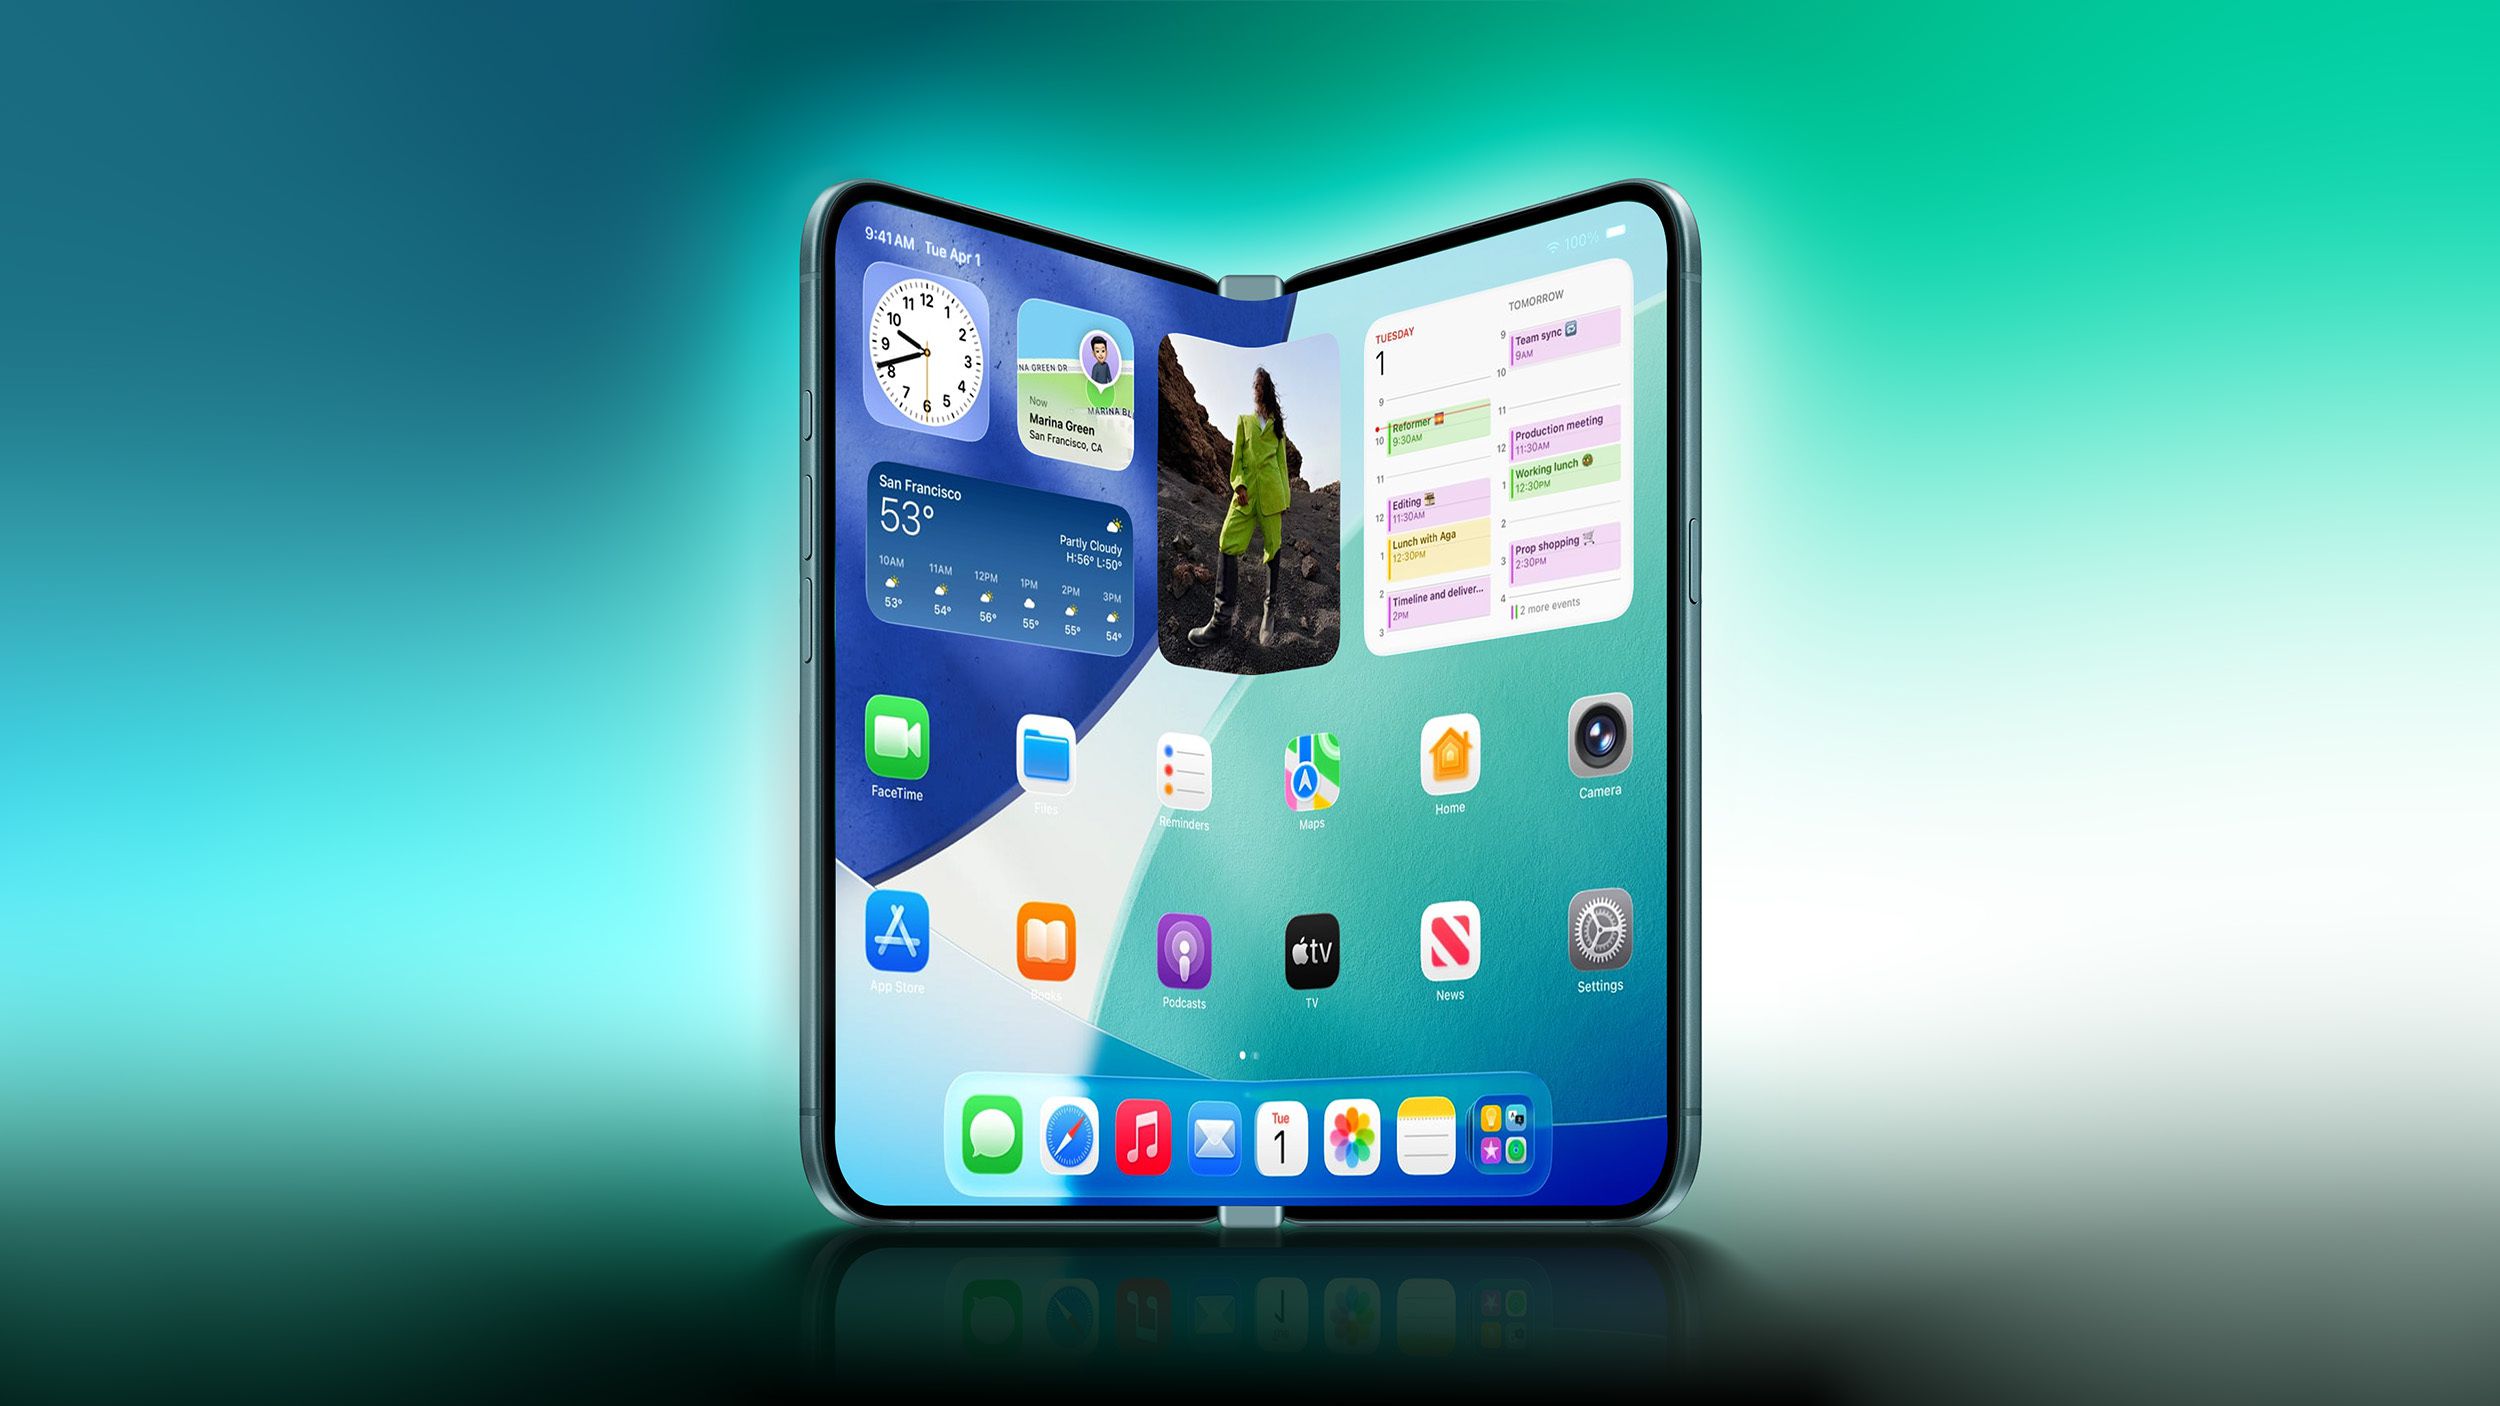
Foldable iPhone is expected to "cross the $2,000 threshold" in the U.S.; Apple’s current most expensive model is the iPhone 17 Pro Max at $1,999 (2TB), and the foldable could top out near $2,799 if similar storage-tier pricing applies. Device rumored for a September unveiling, possibly branded iPhone Ultra, with a 7.7-inch inner display, 5.3-inch outer display, two rear cameras, one front camera, and a Touch ID power button; pricing/configuration details remain unclear.
Apple introducing a premium foldable creates a disproportionate ASP and margin lever even if unit volumes are small. A 5–10m unit run at a materially higher price point would translate into a mid‑single to low‑double digit percentage lift to hardware revenue without meaningfully increasing installed base; the real margin delta comes from higher attach rates for AppleCare, accessories, and services on buyers who are already high‑ARPU. Expect the initial P&L benefit to show up in services revenue growth and gross margins within the next 2–4 quarters as purchase cohorts on the device monetize through subscriptions and repairs. Second‑order supply chain winners/losers will diverge from headline component suppliers. Flexible display and hinge specialists will see outsized order volatility and negotiating leverage swings — winners with differentiated, hard‑to‑replicate tech can command premium pricing, while commodity suppliers risk one‑time engineering concessions as Apple pushes reliability targets. Independent repair channels and insurance underwriters will be exposed to higher claim incidence and replacement economics; Apple’s trade‑in/recertification program can blunt channel resale value, pressuring third‑party used device margins within 6–12 months. Key catalysts and risks are concentrated and near‑term: launch reception, professional teardown results on durability, and component supplier guide‑downs/upgrades across 1–3 earnings cycles. Durability or hinge reliability issues would rapidly reverse the premium narrative and force steep promotional or warranty provisioning, while smooth initial feedback could compress competitors’ pricing power over 12–24 months. Watch supplier order flow and AppleCare attach metrics as leading indicators—the first two quarters post‑launch will set a 12–24 month revenue trajectory.
AI-powered research, real-time alerts, and portfolio analytics for institutional investors.
Request DemoOverall Sentiment
neutral
Sentiment Score
0.00
Ticker Sentiment