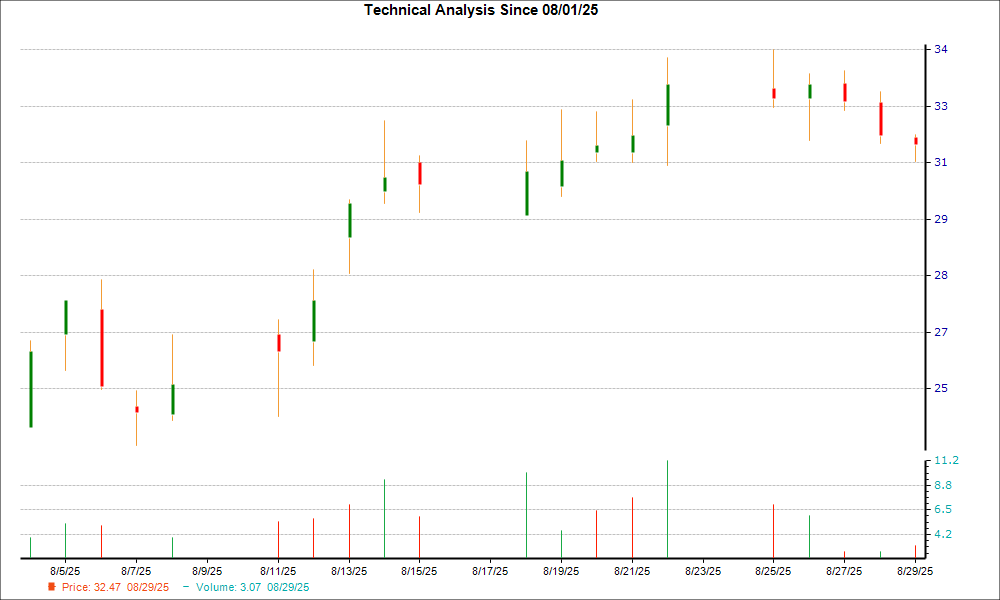
XOMA Royalty (XOMA) has recently formed a hammer chart pattern following a 5.1% weekly decline, signaling potential support and a trend reversal. This technical indicator is strongly supported by fundamental factors, including a remarkable 3671.4% increase in the consensus EPS estimate for the current year over the past 30 days, reflecting significant analyst optimism. Furthermore, XOMA holds a Zacks Rank #1 (Strong Buy), positioning it as a potential 'buy the bottom' opportunity given its strong prospects for outperformance.
XOMA Royalty (XOMA) presents a compelling case for a potential trend reversal, supported by both technical and fundamental indicators. Following a 5.1% decline over the past week, the stock formed a hammer candlestick pattern, a technical signal suggesting that selling pressure may be exhausted and a price floor has been established. This technical setup is substantially reinforced by a powerful fundamental catalyst: the consensus EPS estimate for the current fiscal year has surged by an exceptional 3671.4% in the last 30 days. This dramatic upward revision indicates a significant positive shift in analyst sentiment and expectations regarding the company's near-term earnings potential. The bullish outlook is further corroborated by its Zacks Rank #1 (Strong Buy), a designation based on positive earnings estimate trends, which historically correlates with market outperformance.
AI-powered research, real-time alerts, and portfolio analytics for institutional investors.
Request DemoOverall Sentiment
extremely positive
Sentiment Score
0.85
Ticker Sentiment
