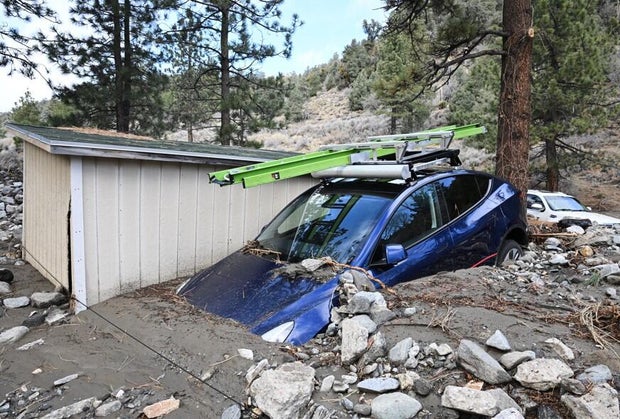
A powerful atmospheric river struck California, producing waves up to 25 feet, 4–8 inches of rain in many lowland areas versus the typical 0.5–1 inch, the wettest Christmas season in downtown Los Angeles in 54 years, roughly 70,000 homes and businesses briefly without power, and at least two storm-related deaths; roads in Wrightwood were buried by mud and rock and officials readied evacuations while 150+ firefighters and the California National Guard were mobilized with emergency declarations in six counties. The system threatens coastal flooding, flash floods near Los Angeles, Sierra Nevada avalanches and travel disruptions during a peak travel week, creating downside risk for regional utilities, insurers, transportation and travel-related revenues and near-term pressure on local infrastructure and services.
Market structure: Immediate winners are home-repair and emergency-equipment suppliers (Generac GNRC, Home Depot HD, Lowe's LOW), heavy-materials and aggregate producers (Vulcan Materials VMC) and regional contractors that can price short-term scarcity; losers are CA-exposed property insurers (TRV, ALL), airlines/hotels serving leisure routes (UAL, AAL, MAR) and small municipal budgets facing cleanup costs. Pricing power should briefly shift to materials/contractors (expect 5–15% margin uplift for local aggregates over 1–3 months if logistics restrict supply). Cross-assets: insurer equity and insurance-linked securities (cat bonds) will see volatility; muni spreads could widen 10–30bps on issuance to fund recovery.
Risk assessment: Tail risks include a major utility or infrastructure failure triggering large BI (business interruption) claims, a >$2–5bn cumulative insured-loss event for the region, or regulatory rate caps on utility recoveries. Time horizons: days for travel disruption, weeks–months for repair demand and claims filings, and quarters–years for insurers’ reserve adjustments and state/federal infrastructure spending. Hidden dependencies include labor/aggregate availability and port/logistics congestion that can amplify cost inflation for repairs. Catalysts: additional atmospheric rivers, published insurer loss estimates (next 30–90 days), and state/federal funding decisions.
Trade implications: Favor tactical longs in GNRC (backup power), VMC (aggregates) and HD/LOW for 1–12 months using concentrated equity or call spreads; use options to limit downside. Hedge insurer exposure via 3-month puts on TRV/ALL sized to potential reserve revisions; consider a pair trade long HD (1.5% portfolio) / short UAL (1.0%) for a 1–3 month window to capture repair-demand vs. travel softness. Monitor implied volatility in insurer names — buy protection if IV < historical 90-day realized + 50%.
Contrarian angles: The market may over-penalize CA travel names intraday while underpricing multi-quarter upside for builders and resilience-equipment makers; historically (e.g., 2017 CA storms) materials and generators outperformed by 10–30% over 3–12 months. Risks to the obvious trades: a quick federal aid package or warm, clear weather could cause a rapid reversion of travel names, so prefer option-based shorts or tight stop-losses. Watch CA emergency declarations and insurer 10-Q reserve updates in the next 30–90 days as the primary data triggers.
AI-powered research, real-time alerts, and portfolio analytics for institutional investors.
Request DemoOverall Sentiment
moderately negative
Sentiment Score
-0.42
