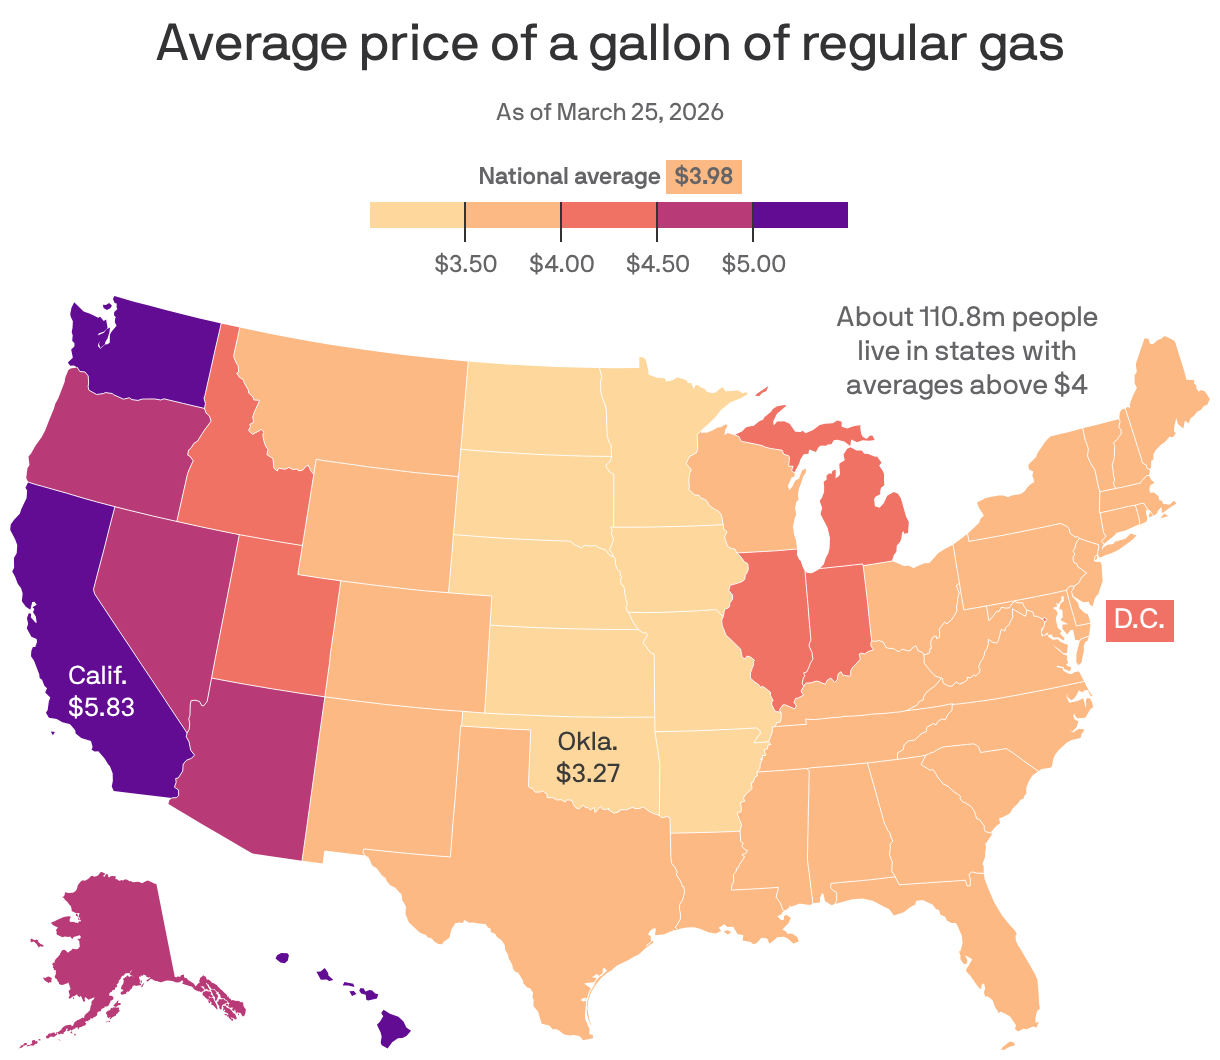
National average gas price is $3.981 per gallon, with 110.8 million people (roughly one-third of the U.S.) living in states where prices exceed $4/gal. Western states are hardest hit: California $5.83/gal, Hawai'i $5.32/gal and Washington $5.30/gal; Arkansas is among the cheapest at $3.39/gal. Before the war, only CA, WA and HI had prices above $4, indicating the price burden has broadened geographically and will likely pressure consumer spending and inflation measures.
Regional pump-price dislocations on the West Coast are not a national convenience-store story — they reflect a structurally segmented supply chain (refinery footprints, marine shipment dependency and state-specific blending/tax regimes) that can sustain a persistent regional premium for months. That premium transmits to real incomes and margins via two channels: elevated local transportation costs (raising delivered goods prices and shrinking discretionary spend) and higher input costs for freight-intensive businesses headquartered or distributed through the West. Expect a 3–9 month window where West Coast crack spreads and retail pump premiums remain above national averages unless a targeted supply response occurs. Second-order winners include assets that capture incremental regional margin or substitution demand: West-facing refiners and marine fuel suppliers, EV charging networks (as marginal consumers consider alternatives), and logistics terminals that can re-route marine cargo. Losers are more concentrated: small/mid consumer staples and discretionary retailers with West-heavy store footprints or distribution centers, regional leisure/tourism businesses (islands and California tourism), and trucking companies facing persistently higher diesel costs. Inflationary persistence in regional CPI measures is a credible policy input risk for local municipal credit and state budgets over the next 12 months. Catalysts that would unwind the premium are discrete: an unplanned ramp in West Coast refining throughput (days–weeks), a material drop in crude or bunker fuel prices (days–months), or policy moves (state tax relief or emergency fuel imports) that blunt the premium. Tail risks to the upside include a geopolitical spike in crude or synchronized refinery outages on the West Coast; to the downside, a sharp recession would compress miles driven and erase the premium within 2–3 months. The consensus treats this as transitory; our read is that regulatory and capital constraints make the West premium stickier — tradeable over a 3–12 month horizon, with a parallel multi-year structural upside for EV infrastructure if prices stay elevated.
AI-powered research, real-time alerts, and portfolio analytics for institutional investors.
Request DemoOverall Sentiment
mildly negative
Sentiment Score
-0.25