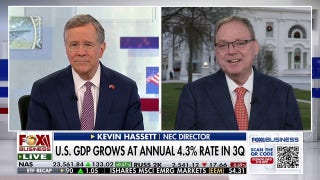
A White House Council of Economic Advisers analysis using BLS year-over-year CPI data through November 2025 finds average inflation of 2.5% in conservative-led states versus 3.0% in liberal-led states, with metro areas in conservative states at 1.9% versus 3.0% in liberal metros. The CEA attributes most of the gap to faster energy and transportation price increases in liberal-run cities, while housing inflation remains elevated nationwide and is rising slightly faster in liberal-led states. The regional divergence could shape voter concerns and policy debates on energy, transportation and housing affordability, with the administration signaling forthcoming housing proposals.
Market structure: Energy and transportation suppliers and midstream operators are the immediate beneficiaries as the CEA flags energy/transport as the primary driver of the inflation gap (conservative states 2.5% vs liberal 3.0%). Producers with heavy exposure to onshore U.S. basins (Permian/Marcellus) and pipeline toll-takers gain pricing power if local retail energy remains elevated in liberal metros; airlines and urban transit operators are structural losers as higher fuel and commuting costs depress discretionary travel and margin. Cross-asset: persistent regional inflation dispersion favors commodity longs (WTI/Brent) and TIPS over long-duration corporate credit; regional muni spreads may compress in low-inflation conservative states, while FX impacts are minimal absent broader U.S. inflation moves.
Risk assessment: Tail risks include a policy shock (federal housing relief or energy subsidy reversal) that compresses energy spreads or bursts a housing repricing — both could reverse current asymmetry within 30–90 days. Near-term (days–weeks) volatility will hinge on the administration’s housing plan (expected early next year) and monthly CPI prints; medium-term (3–12 months) drivers are oil price trajectory and commuter demand normalization. Hidden dependencies: localized energy price moves can be driven by weather, refinery outages, or state taxes/regulation rather than fundamental supply, so monitor regional fuel/diesel crack spreads and pipeline nominations for early signals.
Trade implications: Direct plays favor U.S. integrated energy (XOM, CVX) and midstream (KMI, PAA) with 3–12 month horizons; pair trades can be long energy and short airlines (UAL, AAL) to capture fuel-driven margin pressure. Options: consider 3–9 month call spreads on XOM/CVX to control premium and 1–3 month put protection on XHB or PHM to hedge a policy-driven housing reprice. Sector rotation: overweight energy and select consumer staples in conservative-state retail exposure; underweight regional airlines and cyclical homebuilders until policy clarity.
Contrarian angles: Consensus treats the gap as structural — but it may be transient if the administration’s housing proposal materially increases supply or if a mild winter collapses heating demand; both would hurt energy names and homebuilders differently. The market may be underpricing policy risk (housing supply measures) and overpricing persistent regional energy pricing — creating mispricings in homebuilder equities and midstream if crude falls < $65 for 60 days. Historical parallels: regional inflation divergences in 2010s resolved within 6–12 months after policy/seasonal shocks, so maintain tactical sizing and tight risk controls.
AI-powered research, real-time alerts, and portfolio analytics for institutional investors.
Request DemoOverall Sentiment
neutral
Sentiment Score
0.00
