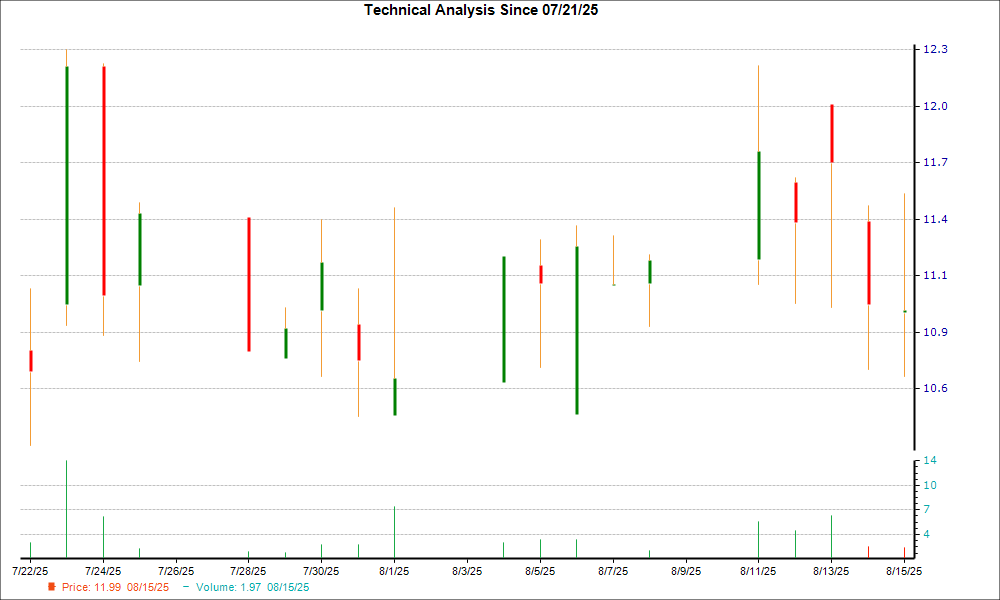
Antalpha Platform Holding Company (ANTA) shares, which recently declined 9.8%, are signaling a potential turnaround following the formation of a 'hammer chart pattern' in its last trading session, indicating technical support. This technical indicator is bolstered by fundamental strength, as Wall Street analysts have collectively raised the consensus EPS estimate for the current year by 4.2% over the past 30 days. Furthermore, ANTA's Zacks Rank #2 (Buy) suggests strong prospects for outperformance, positioning the stock for a potential reversal from its recent downtrend.
Antalpha Platform Holding Company (ANTA) shares have exhibited significant weakness, declining 9.8% over the past week, but recent signals suggest a potential trend reversal. A 'hammer' candlestick pattern formed in the last trading session, a technical indicator that often points to a potential price bottom as buying interest absorbed selling pressure. This bullish technical signal is substantiated by improving fundamentals. Wall Street analysts have increased the consensus EPS estimate for the current year by 4.2% over the last 30 days, indicating heightened expectations for the company's earnings potential. Furthermore, the stock carries a Zacks Rank #2 (Buy), placing it in the top 20% of ranked companies based on earnings estimate trends, a factor historically associated with near-term outperformance.
AI-powered research, real-time alerts, and portfolio analytics for institutional investors.
Request DemoOverall Sentiment
strongly positive
Sentiment Score
0.75
Ticker Sentiment
