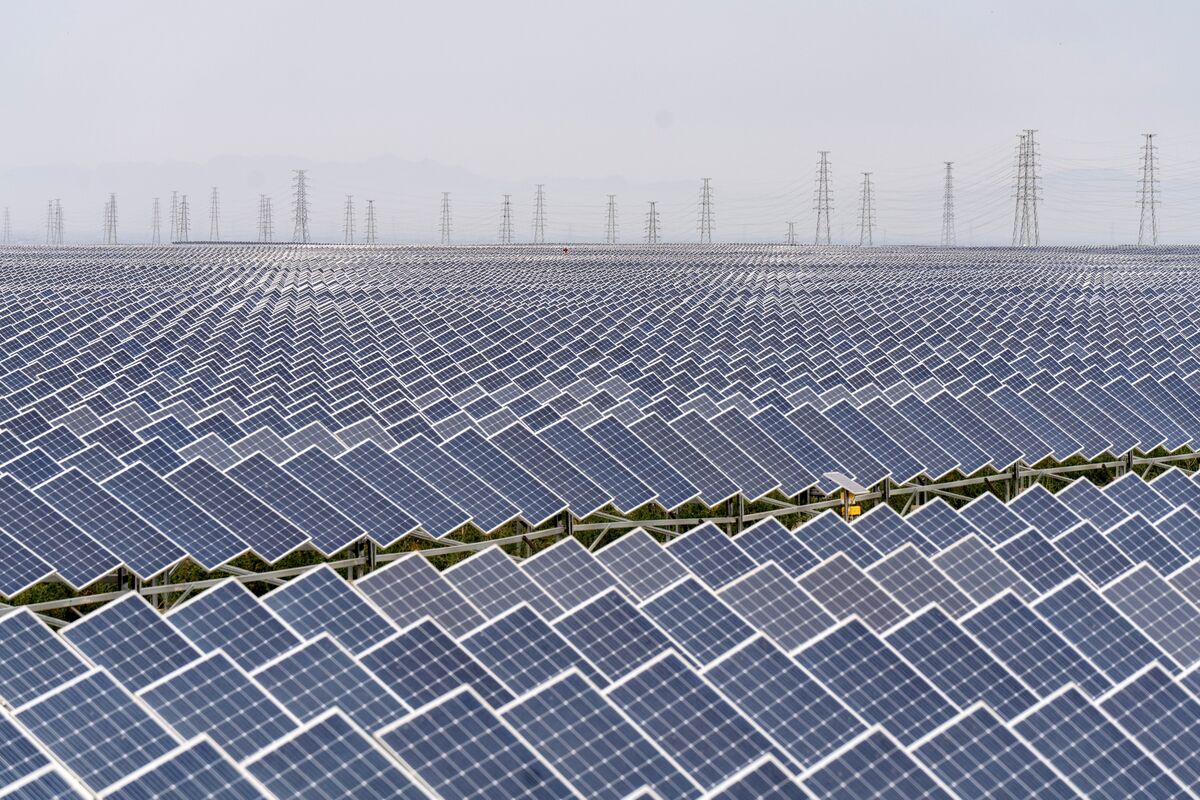
China added 12.6 GW of solar capacity in October, up from 9.66 GW in September but down from 20.4 GW a year earlier, according to National Energy Administration data. The monthly pickup signals a continued recovery from a near three-year low in August but leaves installations materially below last year’s pace, a dynamic with implications for Chinese module manufacturers, project pipelines and near-term demand in the solar supply chain.
Market structure: The MoM pickup but large YoY shortfall implies demand is recovering unevenly and pricing remains the dominant margin lever. Expect module and polysilicon spot prices to stay under downward pressure until monthly Chinese installs consistently exceed ~18–20 GW for two consecutive months, which is the threshold that historically restores OEM pricing power.
Risk assessment: Near-term (days–weeks) downside is idiosyncratic to Chinese OEM equity and high-yield debt as inventory draws and margin compression widen credit spreads; medium-term (3–12 months) the key tail risks are policy stimulus in China (rapid upside) or accelerated destocking and bankruptcies among smaller manufacturers (downside). Hidden dependencies include international anti-dumping rulings, FX moves (CNY weakness amplifies USD-denominated cost relief) and project finance availability that can flip demand quickly.
Trade implications: Favor tactical short exposure to levered Chinese module manufacturers and selective long exposure to project owners/contracted developers who benefit from cheaper modules improving IRR in 6–12 months. Use option structures to cap capital at risk around near-term volatility spikes; size trades to 0.5–2% of AUM per idea and define clear exit triggers tied to NEA install data and polysilicon spot moves.
Contrarian angles: Market consensus will latently treat the MoM uptick as recovery; that understates persistent YoY weakness and the high likelihood of consolidation among Chinese OEMs, creating M&A targets and survival-value trade opportunities. If two more modest months of installs arrive (12–16 GW), the market will likely overreact downwards — creating disciplined re-entry points into well-capitalized names.
AI-powered research, real-time alerts, and portfolio analytics for institutional investors.
Overall Sentiment
mildly positive
Sentiment Score
0.25
