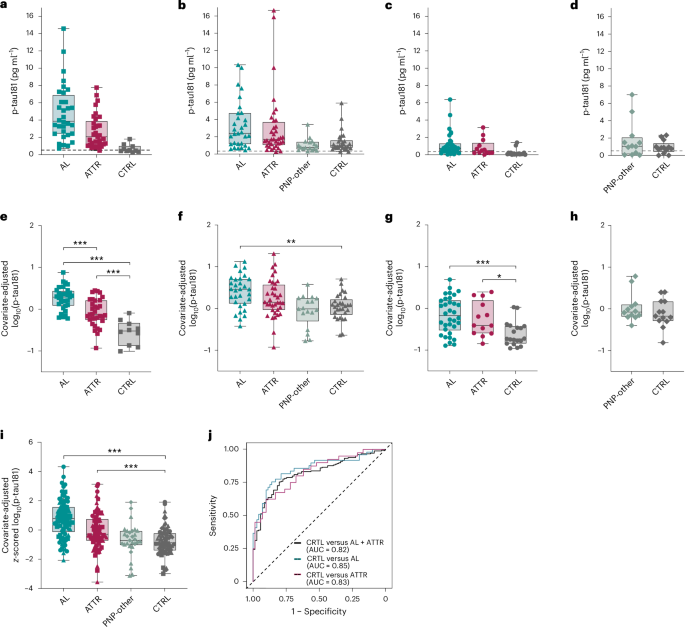
Serum phosphorylated tau (p-tau181) discriminated systemic amyloidosis (AL and ATTR combined) from controls with AUC 0.82, with Youden threshold 0.68 producing sensitivity 75% and specificity 80%; site AUCs ranged from 0.74–0.94. p-tau181 showed ~2–3x elevations versus controls (similar to symptomatic AD’s 2.4x), increases were more pronounced with polyneuropathy and present in presymptomatic ATTRv carriers (correlated with predicted years to onset). p-tau217 produced comparable relative increases and AUCs (overall 0.77; AL 0.75, ATTR 0.79). Implication: p-tau assays may serve as blood biomarkers for AL/ATTR amyloidosis (and for staging), but elevations outside Alzheimer’s disease may complicate p-tau use as a presymptomatic AD-specific test.
The immediate commercial implication is a bifurcation of the p‑tau testing market: vendors who can prove tissue‑of‑origin specificity will command premium pricing while commodity assays will face pricing pressure. For a platform owner with a large installed base, this creates a two‑track monetization path — sell high‑margin follow‑up isoform/“big‑tau” assays to specialty clinics and keep volume via broadly distributed screening assays. Expect the earliest commercial levers (partnerships with rare‑disease centers, CLIA lab offerings) to show revenue inflection within 12–24 months; formal IVD clearance and payer coverage will follow in the 18–36 month window.
A substitution effect across the diagnostic ecosystem is likely: higher‑throughput blood testing reduces demand elasticity for some imaging/biopsy procedures but increases upstream sample flow to central labs and reagent makers. This creates a supply‑side squeeze risk for antibody suppliers and contract testing capacity during the scale‑up phase, potentially compressing margins for newcomers that cannot secure supply contracts. Conversely, firms that control both instruments and reagents gain leverage to bundle discounts and lock customers into longer reagent contracts.
Key risks that could reverse adoption include failure to replicate utility in large prospective cohorts, payer resistance to reimbursing non‑tissue confirmatory tests, and persistent analytical confounders (renal function, pre‑analytical variability). These are binary catalysts: negative replications or unfavorable CMS/NCD decisions could halve adoption forecasts within 6–12 months. Monitor upcoming multicenter validation readouts and partnership announcements as the primary short‑term catalysts.
AI-powered research, real-time alerts, and portfolio analytics for institutional investors.
Request DemoOverall Sentiment
neutral
Sentiment Score
0.00
Ticker Sentiment
Contrarian angle: the headline concern about diagnostic specificity understates TAM expansion. If vendors deliver validated tissue‑specific assays, payers will likely prefer staged testing (cheap blood screen → targeted confirmatory imaging/biopsy), increasing lifetime testing per patient and overall spend per diagnostic episode. That sequencing favors platforms with flexible assay menus and installed instrumentation rather than single‑product competitors.