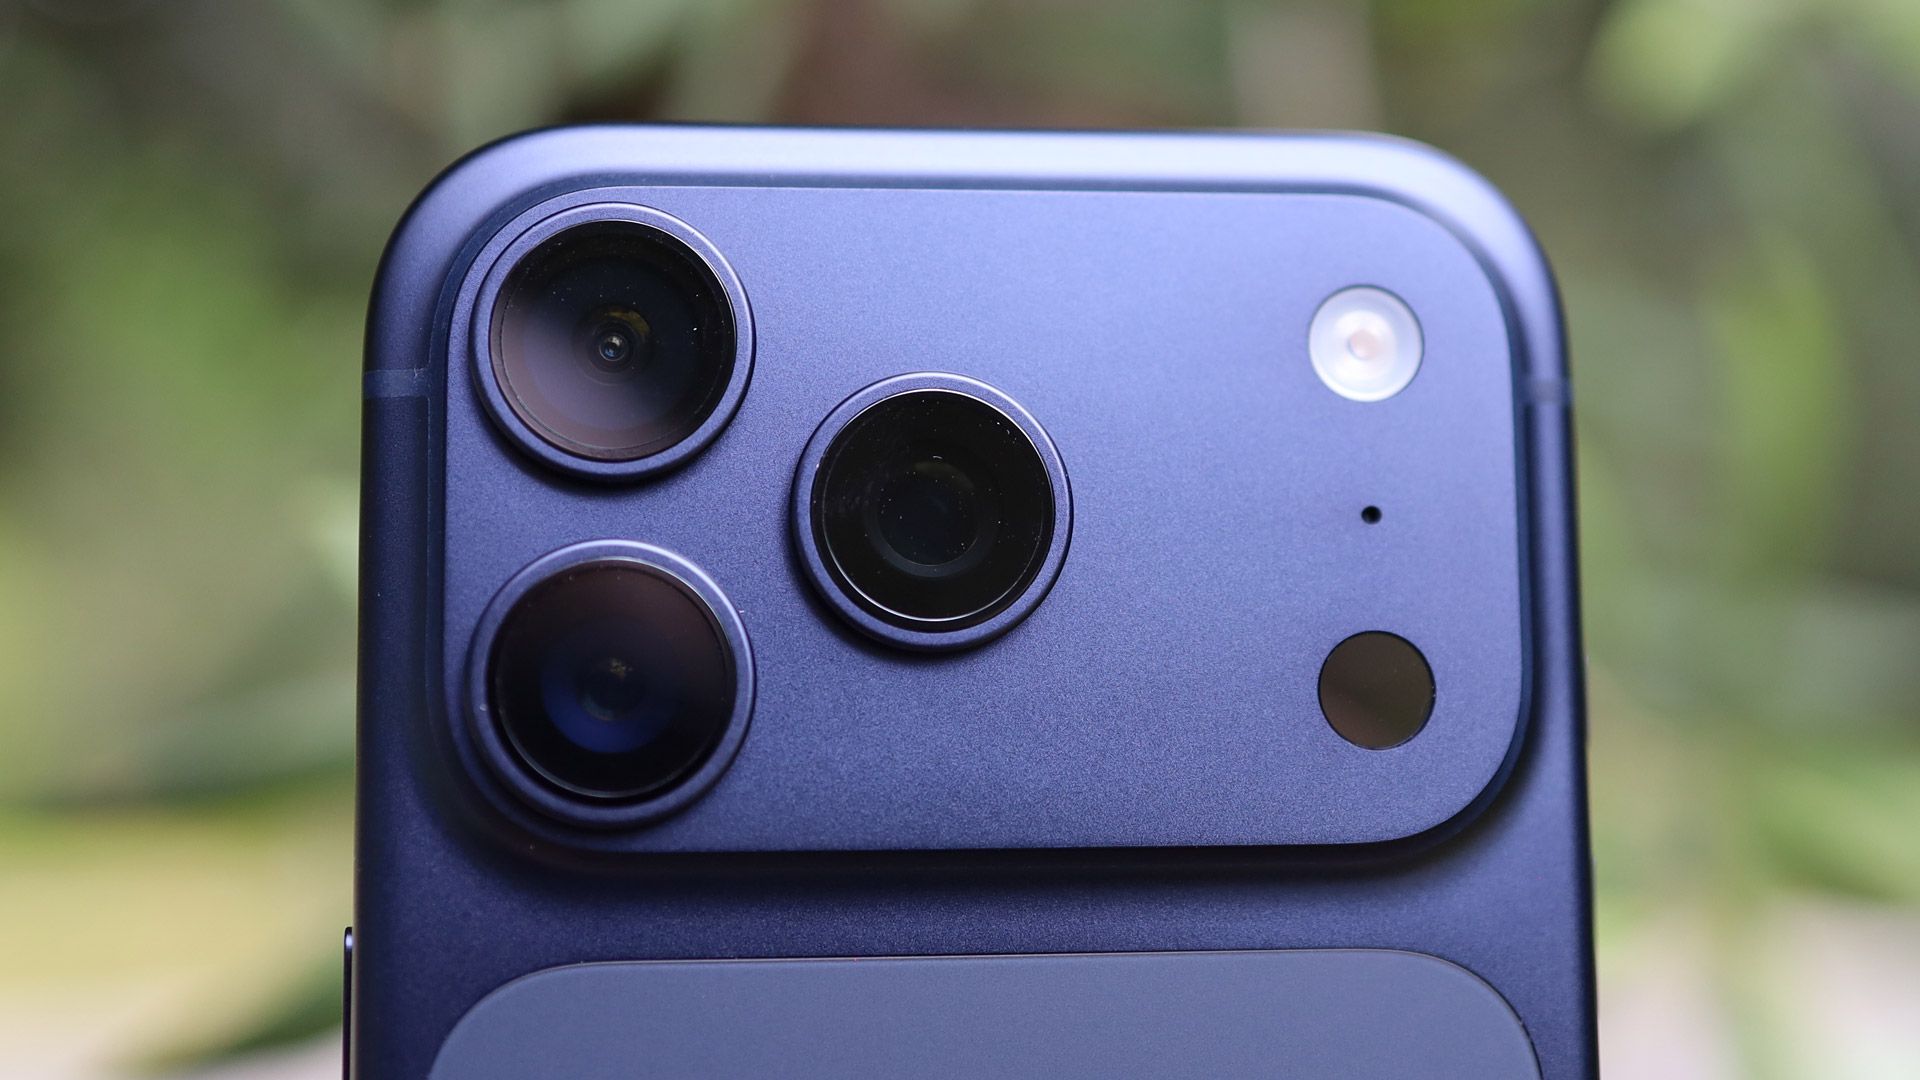
Major US carriers are running aggressive Black Friday promotions on Apple's iPhone 17 series, with reported discounts and rebates ranging roughly $820–$1,100 across Verizon, T‑Mobile and AT&T. Verizon is marketing a free iPhone 17 with a new unlimited line plus a free iPad and Apple Watch (accessory cellular lines apply and can add roughly $30/month), T‑Mobile is offering up to four free iPhone 17 devices on a four‑line Essentials plan at $100/month total ($25/line) and up to $1,000 off with a switch, and AT&T is promoting up to $1,100 in trade‑in credit and an iPhone Air at $12.99/month with a new plan. These promotions intensify competitive pressure for net adds but risk compressing ARPU and device margin; investors should monitor subscriber additions, churn trends and promotional intensity rather than treating these as one‑off sales events.
Market structure: Apple (AAPL) and large retailers (BBY, AMZN, WMT) are clear near-term winners as $820–$1,100 handset discounts and multi-line promotions (T‑Mobile: 4 lines ≈ $100/mo total) drive incremental unit sell‑through. Carriers (T, VZ, TMUS) face a trade‑off: volume and lower churn versus ARPU/EBITDA dilution; expect near‑term carrier EBITDA margin pressure of ~50–200bps depending on accessory line add‑ons ($20–30/mo each). Cross‑asset: modest widening of credit spreads for high‑debt carriers is plausible (10–30bps), short‑dated options vol for carriers should rise 10–25% into earnings, FX/commodity impacts negligible.
Risk assessment: Tail risks include regulatory action on bundling/subsidies (FTC/DOJ review) or an Apple supply shortfall reducing replacements — both low probability but high impact for Q1 revenues. Time horizons split: immediate (days) = sales/traffic data and retailer comps; short (weeks–months) = carrier Q4 ARPU/net adds and margin prints; long (quarters) = lifetime subscriber revenue recouping handset cost. Hidden dependency: many “free” devices require accessory cellular lines that materially change LTV math; trade‑in accounting and device revenue recognition could mask true subsidy cost. Key catalysts: weekly sell‑through reports, carrier Nov/Dec guidance updates, Apple channel inventory disclosures.
Trade implications: Direct plays: establish a 1–2% long AAPL position into Jan 2026 to capture unit upside and services tailwinds if carriers report >3% unit growth; overweight TMUS (1% long) to capture multi‑line share gains. Defensive/hedge: initiate 0.5–1% short T (or buy 3‑month ATM puts) as ARPU pressure could compress EBITDA by 100–150bps if accessory uptake is low; add 0.5–1% long BBY for holiday comp upside. Options: buy AAPL Jan 2026 call spreads (buy 1, sell 1 higher strike) to limit capital; buy 3‑month puts on T sized to expected drawdown if Q4 ARPU misses by >$2.
Contrarian angles: Consensus prices carriers as the loss‑makers; but history (2019, 2020 promo cycles) shows handset subsidies often financed by OEM incentives and recovered in 6–12 months — so short‑carrier trades can be time‑limited and overdone. Monitor Apple’s incentive payments (channel inventory + sell‑through) over next 30–60 days — if Apple is absorbing >30% of subsidy, carrier margin risk is overstated and AAPL/retail longs are underpriced. Unintended consequence: aggressive promos accelerate consolidation (benefit TMUS/VZ longer term) and higher subscriber base could lift services ARPU by 100–200bps over 2–3 quarters.
AI-powered research, real-time alerts, and portfolio analytics for institutional investors.
Request DemoOverall Sentiment
mildly positive
Sentiment Score
0.30
Ticker Sentiment
